Scotch-Irish vs Luxembourger Householder Income Ages 25 - 44 years
COMPARE
Scotch-Irish
Luxembourger
Householder Income Ages 25 - 44 years
Householder Income Ages 25 - 44 years Comparison
Scotch-Irish
Luxembourgers
$89,969
HOUSEHOLDER INCOME AGES 25 - 44 YEARS
7.3/ 100
METRIC RATING
217th/ 347
METRIC RANK
$97,237
HOUSEHOLDER INCOME AGES 25 - 44 YEARS
81.5/ 100
METRIC RATING
141st/ 347
METRIC RANK
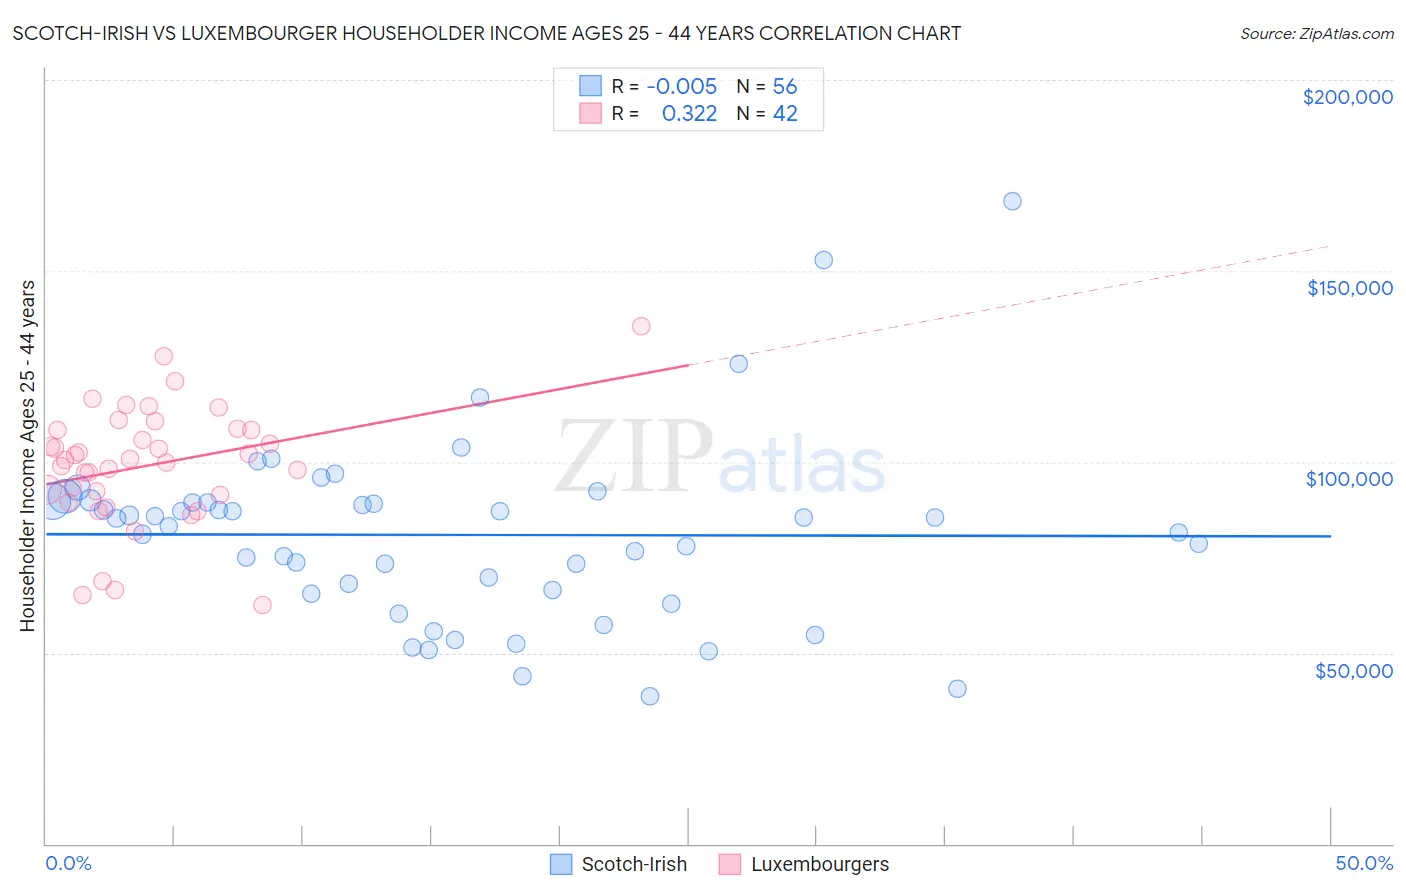
Scotch-Irish vs Luxembourger Householder Income Ages 25 - 44 years Correlation Chart
The statistical analysis conducted on geographies consisting of 544,063,779 people shows no correlation between the proportion of Scotch-Irish and household income with householder between the ages 25 and 44 in the United States with a correlation coefficient (R) of -0.005 and weighted average of $89,969. Similarly, the statistical analysis conducted on geographies consisting of 144,399,527 people shows a mild positive correlation between the proportion of Luxembourgers and household income with householder between the ages 25 and 44 in the United States with a correlation coefficient (R) of 0.322 and weighted average of $97,237, a difference of 8.1%.
Householder Income Ages 25 - 44 years Correlation Summary
| Measurement | Scotch-Irish | Luxembourger |
| Minimum | $38,615 | $62,500 |
| Maximum | $168,086 | $135,353 |
| Range | $129,471 | $72,853 |
| Mean | $80,873 | $99,089 |
| Median | $84,225 | $100,624 |
| Interquartile 25% (IQ1) | $65,999 | $91,375 |
| Interquartile 75% (IQ3) | $89,511 | $108,286 |
| Interquartile Range (IQR) | $23,512 | $16,911 |
| Standard Deviation (Sample) | $23,988 | $15,610 |
| Standard Deviation (Population) | $23,773 | $15,424 |
Similar Demographics by Householder Income Ages 25 - 44 years
Demographics Similar to Scotch-Irish by Householder Income Ages 25 - 44 years
In terms of householder income ages 25 - 44 years, the demographic groups most similar to Scotch-Irish are Guyanese ($89,940, a difference of 0.030%), Delaware ($89,876, a difference of 0.10%), Trinidadian and Tobagonian ($89,856, a difference of 0.13%), Ghanaian ($90,137, a difference of 0.19%), and Panamanian ($90,193, a difference of 0.25%).
| Demographics | Rating | Rank | Householder Income Ages 25 - 44 years |
| Immigrants | Kenya | 10.9 /100 | #210 | Poor $90,767 |
| Iraqis | 10.8 /100 | #211 | Poor $90,764 |
| Hawaiians | 10.6 /100 | #212 | Poor $90,722 |
| Immigrants | Bangladesh | 9.3 /100 | #213 | Tragic $90,448 |
| Immigrants | Africa | 8.9 /100 | #214 | Tragic $90,372 |
| Panamanians | 8.1 /100 | #215 | Tragic $90,193 |
| Ghanaians | 7.9 /100 | #216 | Tragic $90,137 |
| Scotch-Irish | 7.3 /100 | #217 | Tragic $89,969 |
| Guyanese | 7.1 /100 | #218 | Tragic $89,940 |
| Delaware | 6.9 /100 | #219 | Tragic $89,876 |
| Trinidadians and Tobagonians | 6.8 /100 | #220 | Tragic $89,856 |
| Immigrants | Trinidad and Tobago | 6.5 /100 | #221 | Tragic $89,748 |
| Immigrants | Ecuador | 6.2 /100 | #222 | Tragic $89,673 |
| Immigrants | Guyana | 5.9 /100 | #223 | Tragic $89,586 |
| Barbadians | 5.9 /100 | #224 | Tragic $89,565 |
Demographics Similar to Luxembourgers by Householder Income Ages 25 - 44 years
In terms of householder income ages 25 - 44 years, the demographic groups most similar to Luxembourgers are Danish ($97,221, a difference of 0.020%), Immigrants from Jordan ($97,185, a difference of 0.050%), Immigrants from Morocco ($97,305, a difference of 0.070%), Immigrants from Chile ($97,159, a difference of 0.080%), and Immigrants from Peru ($97,329, a difference of 0.090%).
| Demographics | Rating | Rank | Householder Income Ages 25 - 44 years |
| Canadians | 84.5 /100 | #134 | Excellent $97,625 |
| Immigrants | Oceania | 84.5 /100 | #135 | Excellent $97,623 |
| Hungarians | 83.9 /100 | #136 | Excellent $97,544 |
| Lebanese | 82.3 /100 | #137 | Excellent $97,339 |
| Arabs | 82.3 /100 | #138 | Excellent $97,336 |
| Immigrants | Peru | 82.2 /100 | #139 | Excellent $97,329 |
| Immigrants | Morocco | 82.0 /100 | #140 | Excellent $97,305 |
| Luxembourgers | 81.5 /100 | #141 | Excellent $97,237 |
| Danes | 81.3 /100 | #142 | Excellent $97,221 |
| Immigrants | Jordan | 81.0 /100 | #143 | Excellent $97,185 |
| Immigrants | Chile | 80.8 /100 | #144 | Excellent $97,159 |
| Norwegians | 78.2 /100 | #145 | Good $96,866 |
| Ethiopians | 77.8 /100 | #146 | Good $96,824 |
| Immigrants | Syria | 77.4 /100 | #147 | Good $96,789 |
| Irish | 76.9 /100 | #148 | Good $96,730 |