Chickasaw vs Luxembourger Householder Income Ages 25 - 44 years

COMPARE

Chickasaw
Race
Ancestry
AfghanAfricanAlaska NativeAlaskan AthabascanAlbanianAleutAlsatianAmericanApacheArabArapahoArgentineanArmenianAssyrian/Chaldean/SyriacAustralianAustrianBahamianBangladeshiBarbadianBasqueBelgianBelizeanBermudanBhutaneseBlackfeetBolivianBrazilianBritishBritish West IndianBulgarianBurmeseCajunCambodianCanadianCape VerdeanCarpatho RusynCelticCentral AmericanCentral American IndianCherokeeCheyenneChickasawChileanChineseChippewaChoctawColombianColvilleComancheCosta RicanCreeCreekCroatianCrowCubanCypriotCzechCzechoslovakianDanishDelawareDominicanDutchDutch West IndianEastern EuropeanEcuadorianEgyptianEnglishEstonianEthiopianEuropeanFijianFilipinoFinnishFrenchFrench American IndianFrench CanadianGermanGerman RussianGhanaianGreekGuamanian/ChamorroGuatemalanGuyaneseHaitianHmongHonduranHopiHoumaHungarianIcelanderIndian (Asian)IndonesianInupiatIranianIraqiIrishIroquoisIsraeliItalianJamaicanJapaneseJordanianKenyanKiowaKoreanLaotianLatvianLebaneseLiberianLithuanianLumbeeMacedonianMalaysianMalteseMarshalleseMenomineeMexicanMexican American IndianMongolianMoroccanNative HawaiianNavajoNepaleseNew ZealanderNicaraguanNigerianNorthern EuropeanNorwegianOkinawanOsageOttawaPaiutePakistaniPalestinianPanamanianParaguayanPennsylvania GermanPeruvianPimaPolishPortuguesePotawatomiPuebloPuerto RicanPuget Sound SalishRomanianRussianSalvadoranSamoanScandinavianScotch-IrishScottishSeminoleSenegaleseSerbianShoshoneSierra LeoneanSiouxSlavicSlovakSloveneSomaliSouth AfricanSouth AmericanSouth American IndianSoviet UnionSpaniardSpanishSpanish AmericanSpanish American IndianSri LankanSubsaharan AfricanSudaneseSwedishSwissSyrianTaiwaneseThaiTlingit-HaidaTohono O'OdhamTonganTrinidadian and TobagonianTsimshianTurkishU.S. Virgin IslanderUgandanUkrainianUruguayanUteVenezuelanVietnameseWelshWest IndianYakamaYaquiYugoslavianYumanYup'ikZimbabwean
Immigration
NonimmigrantsImmigrantsAfghanistanAfricaAlbaniaArgentinaArmeniaAsiaAustraliaAustriaBahamasBangladeshBarbadosBelarusBelgiumBelizeBoliviaBosnia and HerzegovinaBrazilBulgariaBurma/MyanmarCabo VerdeCambodiaCameroonCanadaCaribbeanCentral AmericaChileChinaColombiaCongoCosta RicaCroatiaCubaCzechoslovakiaDenmarkDominicaDominican RepublicEastern AfricaEastern AsiaEastern EuropeEcuadorEgyptEl SalvadorEnglandEritreaEthiopiaEuropeFijiFranceGermanyGhanaGreeceGrenadaGuatemalaGuyanaHaitiHondurasHong KongHungaryIndiaIndonesiaIranIraqIrelandIsraelItalyJamaicaJapanJordanKazakhstanKenyaKoreaKuwaitLaosLatin AmericaLatviaLebanonLiberiaLithuaniaMalaysiaMexicoMicronesiaMiddle AfricaMoldovaMoroccoNepalNetherlandsNicaraguaNigeriaNorth AmericaNorth MacedoniaNorthern AfricaNorthern EuropeNorwayOceaniaPakistanPanamaPeruPhilippinesPolandPortugalRomaniaRussiaSaudi ArabiaScotlandSenegalSerbiaSierra LeoneSingaporeSomaliaSouth AfricaSouth AmericaSouth Central AsiaSouth Eastern AsiaSouthern EuropeSpainSri LankaSt. Vincent and the GrenadinesSudanSwedenSwitzerlandSyriaTaiwanThailandTrinidad and TobagoTurkeyUgandaUkraineUruguayUzbekistanVenezuelaVietnamWest IndiesWestern AfricaWestern AsiaWestern EuropeYemenZaireZimbabweAzores
Luxembourger
Race
Ancestry
AfghanAfricanAlaska NativeAlaskan AthabascanAlbanianAleutAlsatianAmericanApacheArabArapahoArgentineanArmenianAssyrian/Chaldean/SyriacAustralianAustrianBahamianBangladeshiBarbadianBasqueBelgianBelizeanBermudanBhutaneseBlackfeetBolivianBrazilianBritishBritish West IndianBulgarianBurmeseCajunCambodianCanadianCape VerdeanCarpatho RusynCelticCentral AmericanCentral American IndianCherokeeCheyenneChileanChineseChippewaChoctawColombianColvilleComancheCosta RicanCreeCreekCroatianCrowCubanCypriotCzechCzechoslovakianDanishDelawareDominicanDutchDutch West IndianEastern EuropeanEcuadorianEgyptianEnglishEstonianEthiopianEuropeanFijianFilipinoFinnishFrenchFrench American IndianFrench CanadianGermanGerman RussianGhanaianGreekGuamanian/ChamorroGuatemalanGuyaneseHaitianHmongHonduranHopiHoumaHungarianIcelanderIndian (Asian)IndonesianInupiatIranianIraqiIrishIroquoisIsraeliItalianJamaicanJapaneseJordanianKenyanKiowaKoreanLaotianLatvianLebaneseLiberianLithuanianLumbeeLuxembourgerMacedonianMalaysianMalteseMarshalleseMenomineeMexicanMexican American IndianMongolianMoroccanNative HawaiianNavajoNepaleseNew ZealanderNicaraguanNigerianNorthern EuropeanNorwegianOkinawanOsageOttawaPaiutePakistaniPalestinianPanamanianParaguayanPennsylvania GermanPeruvianPimaPolishPortuguesePotawatomiPuebloPuerto RicanPuget Sound SalishRomanianRussianSalvadoranSamoanScandinavianScotch-IrishScottishSeminoleSenegaleseSerbianShoshoneSierra LeoneanSiouxSlavicSlovakSloveneSomaliSouth AfricanSouth AmericanSouth American IndianSoviet UnionSpaniardSpanishSpanish AmericanSpanish American IndianSri LankanSubsaharan AfricanSudaneseSwedishSwissSyrianTaiwaneseThaiTlingit-HaidaTohono O'OdhamTonganTrinidadian and TobagonianTsimshianTurkishU.S. Virgin IslanderUgandanUkrainianUruguayanUteVenezuelanVietnameseWelshWest IndianYakamaYaquiYugoslavianYumanYup'ikZimbabwean
Immigration
NonimmigrantsImmigrantsAfghanistanAfricaAlbaniaArgentinaArmeniaAsiaAustraliaAustriaBahamasBangladeshBarbadosBelarusBelgiumBelizeBoliviaBosnia and HerzegovinaBrazilBulgariaBurma/MyanmarCabo VerdeCambodiaCameroonCanadaCaribbeanCentral AmericaChileChinaColombiaCongoCosta RicaCroatiaCubaCzechoslovakiaDenmarkDominicaDominican RepublicEastern AfricaEastern AsiaEastern EuropeEcuadorEgyptEl SalvadorEnglandEritreaEthiopiaEuropeFijiFranceGermanyGhanaGreeceGrenadaGuatemalaGuyanaHaitiHondurasHong KongHungaryIndiaIndonesiaIranIraqIrelandIsraelItalyJamaicaJapanJordanKazakhstanKenyaKoreaKuwaitLaosLatin AmericaLatviaLebanonLiberiaLithuaniaMalaysiaMexicoMicronesiaMiddle AfricaMoldovaMoroccoNepalNetherlandsNicaraguaNigeriaNorth AmericaNorth MacedoniaNorthern AfricaNorthern EuropeNorwayOceaniaPakistanPanamaPeruPhilippinesPolandPortugalRomaniaRussiaSaudi ArabiaScotlandSenegalSerbiaSierra LeoneSingaporeSomaliaSouth AfricaSouth AmericaSouth Central AsiaSouth Eastern AsiaSouthern EuropeSpainSri LankaSt. Vincent and the GrenadinesSudanSwedenSwitzerlandSyriaTaiwanThailandTrinidad and TobagoTurkeyUgandaUkraineUruguayUzbekistanVenezuelaVietnamWest IndiesWestern AfricaWestern AsiaWestern EuropeYemenZaireZimbabweAzores
Householder Income Ages 25 - 44 years
Income
Poverty
Unemployment
Labor Participation
Family Structure
Vehicle Availability
Education Level
Disability

Householder Income Ages 25 - 44 years Comparison

Chickasaw

Luxembourgers

Tragic
Excellent
$77,929
HOUSEHOLDER INCOME AGES 25 - 44 YEARS
0.0/ 100
METRIC RATING
322nd/ 347
METRIC RANK
$97,237
HOUSEHOLDER INCOME AGES 25 - 44 YEARS
81.5/ 100
METRIC RATING
141st/ 347
METRIC RANK

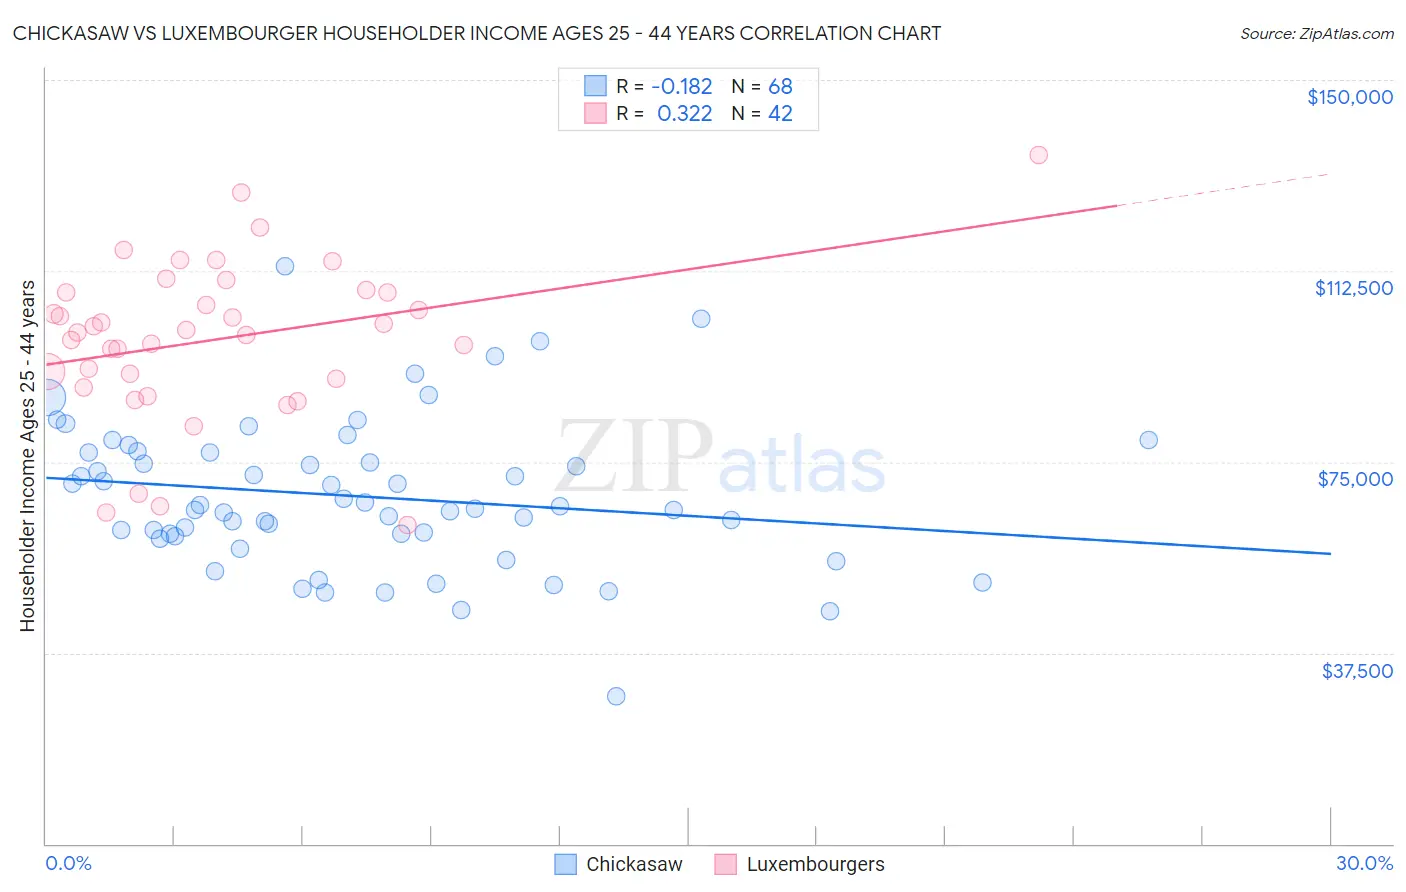
Chickasaw vs Luxembourger Householder Income Ages 25 - 44 years Correlation Chart

The statistical analysis conducted on geographies consisting of 147,542,278 people shows a poor negative correlation between the proportion of Chickasaw and household income with householder between the ages 25 and 44 in the United States with a correlation coefficient (R) of -0.182 and weighted average of $77,929. Similarly, the statistical analysis conducted on geographies consisting of 144,399,527 people shows a mild positive correlation between the proportion of Luxembourgers and household income with householder between the ages 25 and 44 in the United States with a correlation coefficient (R) of 0.322 and weighted average of $97,237, a difference of 24.8%.
Chickasaw vs Luxembourger Householder Income Ages 25 - 44 years

Householder Income Ages 25 - 44 years Correlation Summary

MeasurementChickasawLuxembourger
Minimum$29,071$62,500
Maximum$113,361$135,353
Range$84,290$72,853
Mean$68,238$99,089
Median$66,121$100,624
Interquartile 25% (IQ1)$60,623$91,375
Interquartile 75% (IQ3)$76,882$108,286
Interquartile Range (IQR)$16,259$16,911
Standard Deviation (Sample)$14,676$15,610
Standard Deviation (Population)$14,567$15,424

Similar Demographics by Householder Income Ages 25 - 44 years

Demographics Similar to Chickasaw by Householder Income Ages 25 - 44 years

In terms of householder income ages 25 - 44 years, the demographic groups most similar to Chickasaw are Immigrants from Zaire ($78,045, a difference of 0.15%), Choctaw ($78,168, a difference of 0.31%), Honduran ($78,540, a difference of 0.78%), Immigrants from Honduras ($77,328, a difference of 0.78%), and Dutch West Indian ($77,260, a difference of 0.87%).
DemographicsRating | RankHouseholder Income Ages 25 - 44 years
Ottawa
0.0
/100
|
#315
Tragic
$79,012
Africans
0.0
/100
|
#316
Tragic
$78,986
U.S. Virgin Islanders
0.0
/100
|
#317
Tragic
$78,911
Immigrants | Mexico
0.0
/100
|
#318
Tragic
$78,809
Hondurans
0.0
/100
|
#319
Tragic
$78,540
Choctaw
0.0
/100
|
#320
Tragic
$78,168
Immigrants | Zaire
0.0
/100
|
#321
Tragic
$78,045
Chickasaw
0.0
/100
|
#322
Tragic
$77,929
Immigrants | Honduras
0.0
/100
|
#323
Tragic
$77,328
Dutch West Indians
0.0
/100
|
#324
Tragic
$77,260
Sioux
0.0
/100
|
#325
Tragic
$77,089
Houma
0.0
/100
|
#326
Tragic
$77,044
Immigrants | Bahamas
0.0
/100
|
#327
Tragic
$76,910
Immigrants | Cuba
0.0
/100
|
#328
Tragic
$76,701
Seminole
0.0
/100
|
#329
Tragic
$76,584

Demographics Similar to Luxembourgers by Householder Income Ages 25 - 44 years

In terms of householder income ages 25 - 44 years, the demographic groups most similar to Luxembourgers are Danish ($97,221, a difference of 0.020%), Immigrants from Jordan ($97,185, a difference of 0.050%), Immigrants from Morocco ($97,305, a difference of 0.070%), Immigrants from Chile ($97,159, a difference of 0.080%), and Immigrants from Peru ($97,329, a difference of 0.090%).
DemographicsRating | RankHouseholder Income Ages 25 - 44 years
Canadians
84.5
/100
|
#134
Excellent
$97,625
Immigrants | Oceania
84.5
/100
|
#135
Excellent
$97,623
Hungarians
83.9
/100
|
#136
Excellent
$97,544
Lebanese
82.3
/100
|
#137
Excellent
$97,339
Arabs
82.3
/100
|
#138
Excellent
$97,336
Immigrants | Peru
82.2
/100
|
#139
Excellent
$97,329
Immigrants | Morocco
82.0
/100
|
#140
Excellent
$97,305
Luxembourgers
81.5
/100
|
#141
Excellent
$97,237
Danes
81.3
/100
|
#142
Excellent
$97,221
Immigrants | Jordan
81.0
/100
|
#143
Excellent
$97,185
Immigrants | Chile
80.8
/100
|
#144
Excellent
$97,159
Norwegians
78.2
/100
|
#145
Good
$96,866
Ethiopians
77.8
/100
|
#146
Good
$96,824
Immigrants | Syria
77.4
/100
|
#147
Good
$96,789
Irish
76.9
/100
|
#148
Good
$96,730