Scotch-Irish vs Immigrants from Nepal Median Male Earnings
COMPARE
Scotch-Irish
Immigrants from Nepal
Median Male Earnings
Median Male Earnings Comparison
Scotch-Irish
Immigrants from Nepal
$53,658
MEDIAN MALE EARNINGS
30.6/ 100
METRIC RATING
192nd/ 347
METRIC RANK
$55,615
MEDIAN MALE EARNINGS
75.0/ 100
METRIC RATING
153rd/ 347
METRIC RANK
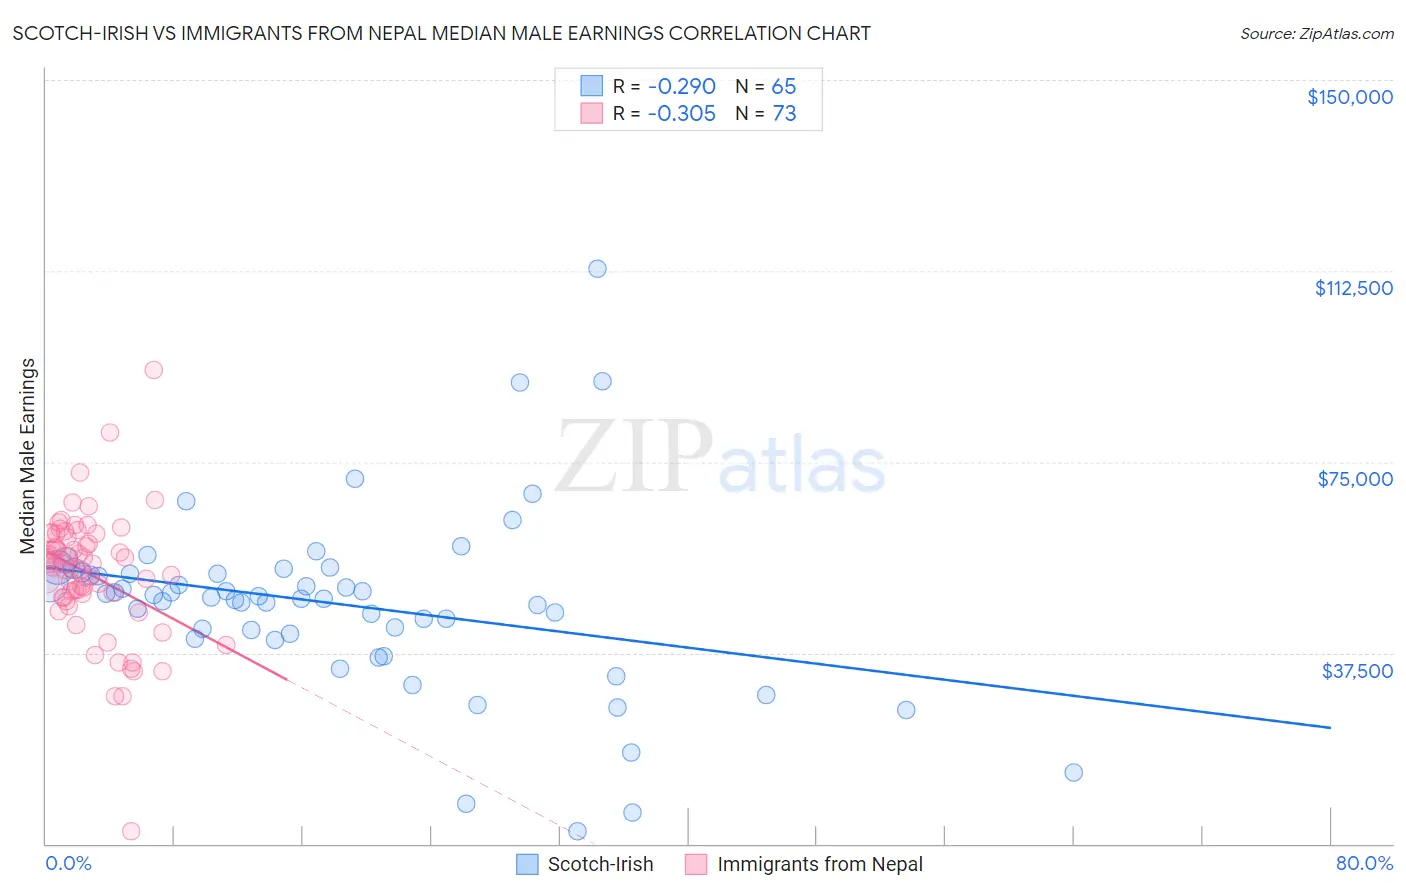
Scotch-Irish vs Immigrants from Nepal Median Male Earnings Correlation Chart
The statistical analysis conducted on geographies consisting of 547,724,250 people shows a weak negative correlation between the proportion of Scotch-Irish and median male earnings in the United States with a correlation coefficient (R) of -0.290 and weighted average of $53,658. Similarly, the statistical analysis conducted on geographies consisting of 186,778,283 people shows a mild negative correlation between the proportion of Immigrants from Nepal and median male earnings in the United States with a correlation coefficient (R) of -0.305 and weighted average of $55,615, a difference of 3.6%.
Median Male Earnings Correlation Summary
| Measurement | Scotch-Irish | Immigrants from Nepal |
| Minimum | $2,499 | $2,499 |
| Maximum | $113,000 | $93,000 |
| Range | $110,501 | $90,501 |
| Mean | $47,040 | $52,957 |
| Median | $48,432 | $54,879 |
| Interquartile 25% (IQ1) | $40,813 | $48,301 |
| Interquartile 75% (IQ3) | $53,223 | $60,442 |
| Interquartile Range (IQR) | $12,411 | $12,141 |
| Standard Deviation (Sample) | $17,914 | $12,480 |
| Standard Deviation (Population) | $17,776 | $12,394 |
Similar Demographics by Median Male Earnings
Demographics Similar to Scotch-Irish by Median Male Earnings
In terms of median male earnings, the demographic groups most similar to Scotch-Irish are Guamanian/Chamorro ($53,661, a difference of 0.010%), Kenyan ($53,647, a difference of 0.020%), Uruguayan ($53,680, a difference of 0.040%), Puget Sound Salish ($53,704, a difference of 0.090%), and Immigrants from Eastern Africa ($53,713, a difference of 0.10%).
| Demographics | Rating | Rank | Median Male Earnings |
| Immigrants | Sierra Leone | 36.0 /100 | #185 | Fair $53,905 |
| Colombians | 34.4 /100 | #186 | Fair $53,832 |
| Immigrants | Eritrea | 31.8 /100 | #187 | Fair $53,715 |
| Immigrants | Eastern Africa | 31.8 /100 | #188 | Fair $53,713 |
| Puget Sound Salish | 31.6 /100 | #189 | Fair $53,704 |
| Uruguayans | 31.1 /100 | #190 | Fair $53,680 |
| Guamanians/Chamorros | 30.7 /100 | #191 | Fair $53,661 |
| Scotch-Irish | 30.6 /100 | #192 | Fair $53,658 |
| Kenyans | 30.4 /100 | #193 | Fair $53,647 |
| Spanish | 29.0 /100 | #194 | Fair $53,576 |
| Immigrants | Azores | 27.5 /100 | #195 | Fair $53,503 |
| Immigrants | Africa | 26.6 /100 | #196 | Fair $53,457 |
| Immigrants | Kenya | 26.0 /100 | #197 | Fair $53,427 |
| Immigrants | Costa Rica | 22.6 /100 | #198 | Fair $53,237 |
| Tongans | 22.3 /100 | #199 | Fair $53,218 |
Demographics Similar to Immigrants from Nepal by Median Male Earnings
In terms of median male earnings, the demographic groups most similar to Immigrants from Nepal are Peruvian ($55,659, a difference of 0.080%), Taiwanese ($55,556, a difference of 0.11%), Scandinavian ($55,527, a difference of 0.16%), Immigrants from Oceania ($55,712, a difference of 0.17%), and Swiss ($55,731, a difference of 0.21%).
| Demographics | Rating | Rank | Median Male Earnings |
| Immigrants | Chile | 80.7 /100 | #146 | Excellent $55,954 |
| Immigrants | Philippines | 78.4 /100 | #147 | Good $55,809 |
| Scottish | 78.2 /100 | #148 | Good $55,793 |
| English | 77.4 /100 | #149 | Good $55,747 |
| Swiss | 77.1 /100 | #150 | Good $55,731 |
| Immigrants | Oceania | 76.8 /100 | #151 | Good $55,712 |
| Peruvians | 75.8 /100 | #152 | Good $55,659 |
| Immigrants | Nepal | 75.0 /100 | #153 | Good $55,615 |
| Taiwanese | 73.9 /100 | #154 | Good $55,556 |
| Scandinavians | 73.4 /100 | #155 | Good $55,527 |
| Immigrants | Ethiopia | 71.6 /100 | #156 | Good $55,434 |
| Icelanders | 71.2 /100 | #157 | Good $55,415 |
| Czechoslovakians | 70.5 /100 | #158 | Good $55,382 |
| Alsatians | 70.5 /100 | #159 | Good $55,380 |
| Basques | 70.3 /100 | #160 | Good $55,370 |