Immigrants vs Immigrants from Nepal Median Male Earnings
COMPARE
Immigrants
Immigrants from Nepal
Median Male Earnings
Median Male Earnings Comparison
Immigrants
Immigrants from Nepal
$54,168
MEDIAN MALE EARNINGS
42.1/ 100
METRIC RATING
181st/ 347
METRIC RANK
$55,615
MEDIAN MALE EARNINGS
75.0/ 100
METRIC RATING
153rd/ 347
METRIC RANK
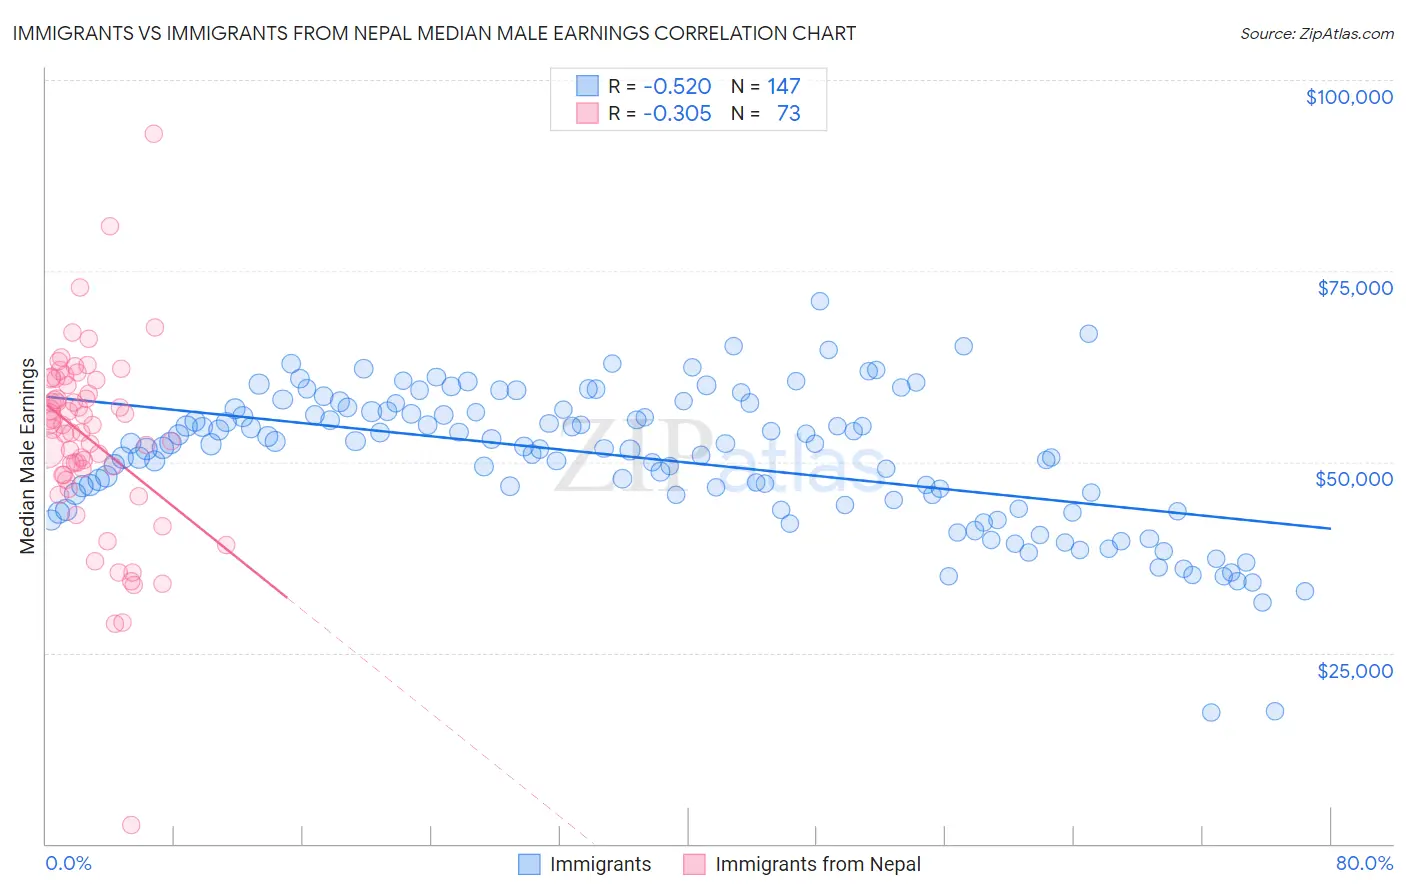
Immigrants vs Immigrants from Nepal Median Male Earnings Correlation Chart
The statistical analysis conducted on geographies consisting of 575,766,345 people shows a substantial negative correlation between the proportion of Immigrants and median male earnings in the United States with a correlation coefficient (R) of -0.520 and weighted average of $54,168. Similarly, the statistical analysis conducted on geographies consisting of 186,778,283 people shows a mild negative correlation between the proportion of Immigrants from Nepal and median male earnings in the United States with a correlation coefficient (R) of -0.305 and weighted average of $55,615, a difference of 2.7%.
Median Male Earnings Correlation Summary
| Measurement | Immigrants | Immigrants from Nepal |
| Minimum | $17,250 | $2,499 |
| Maximum | $71,068 | $93,000 |
| Range | $53,818 | $90,501 |
| Mean | $50,484 | $52,957 |
| Median | $52,327 | $54,879 |
| Interquartile 25% (IQ1) | $44,402 | $48,301 |
| Interquartile 75% (IQ3) | $56,800 | $60,442 |
| Interquartile Range (IQR) | $12,398 | $12,141 |
| Standard Deviation (Sample) | $9,155 | $12,480 |
| Standard Deviation (Population) | $9,124 | $12,394 |
Similar Demographics by Median Male Earnings
Demographics Similar to Immigrants by Median Male Earnings
In terms of median male earnings, the demographic groups most similar to Immigrants are Iraqi ($54,182, a difference of 0.030%), Celtic ($54,242, a difference of 0.14%), Costa Rican ($54,279, a difference of 0.21%), Sierra Leonean ($54,279, a difference of 0.21%), and Yugoslavian ($53,967, a difference of 0.37%).
| Demographics | Rating | Rank | Median Male Earnings |
| South Americans | 50.0 /100 | #174 | Average $54,492 |
| Dutch | 48.0 /100 | #175 | Average $54,410 |
| Spaniards | 47.8 /100 | #176 | Average $54,401 |
| Costa Ricans | 44.8 /100 | #177 | Average $54,279 |
| Sierra Leoneans | 44.8 /100 | #178 | Average $54,279 |
| Celtics | 43.9 /100 | #179 | Average $54,242 |
| Iraqis | 42.5 /100 | #180 | Average $54,182 |
| Immigrants | Immigrants | 42.1 /100 | #181 | Average $54,168 |
| Yugoslavians | 37.4 /100 | #182 | Fair $53,967 |
| Immigrants | South America | 37.3 /100 | #183 | Fair $53,962 |
| Whites/Caucasians | 36.5 /100 | #184 | Fair $53,925 |
| Immigrants | Sierra Leone | 36.0 /100 | #185 | Fair $53,905 |
| Colombians | 34.4 /100 | #186 | Fair $53,832 |
| Immigrants | Eritrea | 31.8 /100 | #187 | Fair $53,715 |
| Immigrants | Eastern Africa | 31.8 /100 | #188 | Fair $53,713 |
Demographics Similar to Immigrants from Nepal by Median Male Earnings
In terms of median male earnings, the demographic groups most similar to Immigrants from Nepal are Peruvian ($55,659, a difference of 0.080%), Taiwanese ($55,556, a difference of 0.11%), Scandinavian ($55,527, a difference of 0.16%), Immigrants from Oceania ($55,712, a difference of 0.17%), and Swiss ($55,731, a difference of 0.21%).
| Demographics | Rating | Rank | Median Male Earnings |
| Immigrants | Chile | 80.7 /100 | #146 | Excellent $55,954 |
| Immigrants | Philippines | 78.4 /100 | #147 | Good $55,809 |
| Scottish | 78.2 /100 | #148 | Good $55,793 |
| English | 77.4 /100 | #149 | Good $55,747 |
| Swiss | 77.1 /100 | #150 | Good $55,731 |
| Immigrants | Oceania | 76.8 /100 | #151 | Good $55,712 |
| Peruvians | 75.8 /100 | #152 | Good $55,659 |
| Immigrants | Nepal | 75.0 /100 | #153 | Good $55,615 |
| Taiwanese | 73.9 /100 | #154 | Good $55,556 |
| Scandinavians | 73.4 /100 | #155 | Good $55,527 |
| Immigrants | Ethiopia | 71.6 /100 | #156 | Good $55,434 |
| Icelanders | 71.2 /100 | #157 | Good $55,415 |
| Czechoslovakians | 70.5 /100 | #158 | Good $55,382 |
| Alsatians | 70.5 /100 | #159 | Good $55,380 |
| Basques | 70.3 /100 | #160 | Good $55,370 |