Romanian vs Immigrants from Armenia Per Capita Income
COMPARE
Romanian
Immigrants from Armenia
Per Capita Income
Per Capita Income Comparison
Romanians
Immigrants from Armenia
$48,445
PER CAPITA INCOME
99.5/ 100
METRIC RATING
79th/ 347
METRIC RANK
$44,552
PER CAPITA INCOME
73.1/ 100
METRIC RATING
148th/ 347
METRIC RANK
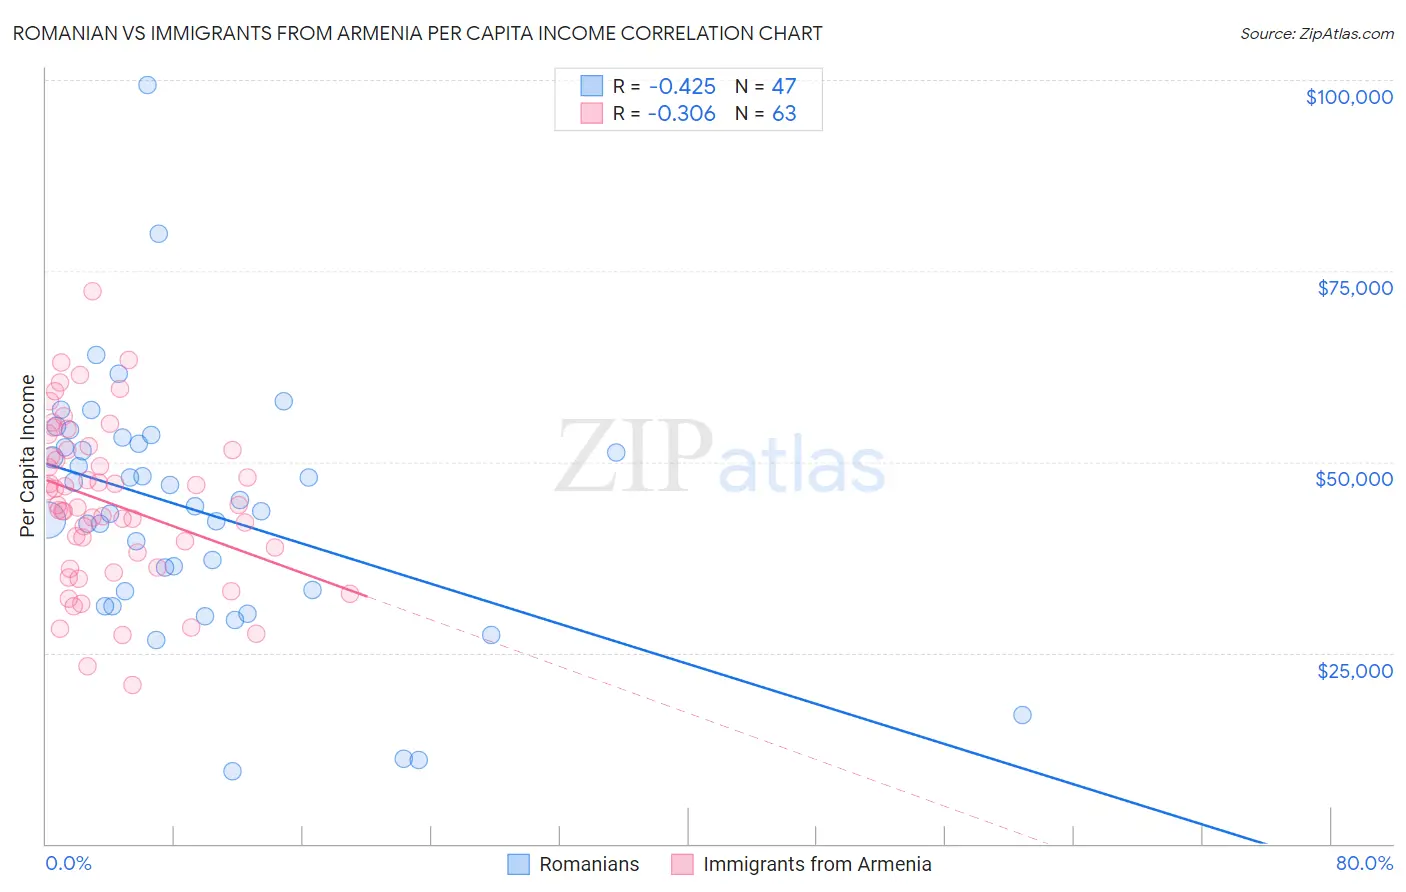
Romanian vs Immigrants from Armenia Per Capita Income Correlation Chart
The statistical analysis conducted on geographies consisting of 377,926,432 people shows a moderate negative correlation between the proportion of Romanians and per capita income in the United States with a correlation coefficient (R) of -0.425 and weighted average of $48,445. Similarly, the statistical analysis conducted on geographies consisting of 97,724,966 people shows a mild negative correlation between the proportion of Immigrants from Armenia and per capita income in the United States with a correlation coefficient (R) of -0.306 and weighted average of $44,552, a difference of 8.7%.
Per Capita Income Correlation Summary
| Measurement | Romanian | Immigrants from Armenia |
| Minimum | $9,471 | $20,812 |
| Maximum | $99,396 | $72,364 |
| Range | $89,925 | $51,552 |
| Mean | $43,633 | $44,626 |
| Median | $44,159 | $44,298 |
| Interquartile 25% (IQ1) | $33,112 | $36,237 |
| Interquartile 75% (IQ3) | $52,383 | $51,558 |
| Interquartile Range (IQR) | $19,271 | $15,321 |
| Standard Deviation (Sample) | $16,424 | $10,685 |
| Standard Deviation (Population) | $16,248 | $10,600 |
Similar Demographics by Per Capita Income
Demographics Similar to Romanians by Per Capita Income
In terms of per capita income, the demographic groups most similar to Romanians are Egyptian ($48,358, a difference of 0.18%), Armenian ($48,287, a difference of 0.33%), Immigrants from Italy ($48,654, a difference of 0.43%), Immigrants from Indonesia ($48,195, a difference of 0.52%), and Immigrants from Brazil ($48,164, a difference of 0.58%).
| Demographics | Rating | Rank | Per Capita Income |
| Immigrants | Hungary | 99.8 /100 | #72 | Exceptional $49,303 |
| Immigrants | North America | 99.8 /100 | #73 | Exceptional $49,302 |
| Mongolians | 99.8 /100 | #74 | Exceptional $49,173 |
| Immigrants | Bolivia | 99.7 /100 | #75 | Exceptional $48,970 |
| Immigrants | England | 99.7 /100 | #76 | Exceptional $48,844 |
| Immigrants | Kazakhstan | 99.7 /100 | #77 | Exceptional $48,747 |
| Immigrants | Italy | 99.6 /100 | #78 | Exceptional $48,654 |
| Romanians | 99.5 /100 | #79 | Exceptional $48,445 |
| Egyptians | 99.5 /100 | #80 | Exceptional $48,358 |
| Armenians | 99.4 /100 | #81 | Exceptional $48,287 |
| Immigrants | Indonesia | 99.4 /100 | #82 | Exceptional $48,195 |
| Immigrants | Brazil | 99.4 /100 | #83 | Exceptional $48,164 |
| Immigrants | Ukraine | 99.3 /100 | #84 | Exceptional $48,134 |
| Austrians | 99.3 /100 | #85 | Exceptional $48,116 |
| Immigrants | Southern Europe | 99.3 /100 | #86 | Exceptional $48,027 |
Demographics Similar to Immigrants from Armenia by Per Capita Income
In terms of per capita income, the demographic groups most similar to Immigrants from Armenia are Korean ($44,522, a difference of 0.070%), Czech ($44,595, a difference of 0.10%), Immigrants from Eritrea ($44,509, a difference of 0.10%), Norwegian ($44,480, a difference of 0.16%), and Peruvian ($44,479, a difference of 0.17%).
| Demographics | Rating | Rank | Per Capita Income |
| Slavs | 82.6 /100 | #141 | Excellent $45,049 |
| Ugandans | 82.6 /100 | #142 | Excellent $45,047 |
| Immigrants | Uganda | 82.5 /100 | #143 | Excellent $45,043 |
| Icelanders | 81.6 /100 | #144 | Excellent $44,987 |
| Immigrants | Afghanistan | 78.0 /100 | #145 | Good $44,790 |
| Irish | 75.8 /100 | #146 | Good $44,679 |
| Czechs | 74.1 /100 | #147 | Good $44,595 |
| Immigrants | Armenia | 73.1 /100 | #148 | Good $44,552 |
| Koreans | 72.5 /100 | #149 | Good $44,522 |
| Immigrants | Eritrea | 72.1 /100 | #150 | Good $44,509 |
| Norwegians | 71.5 /100 | #151 | Good $44,480 |
| Peruvians | 71.5 /100 | #152 | Good $44,479 |
| Scottish | 70.6 /100 | #153 | Good $44,440 |
| Portuguese | 68.7 /100 | #154 | Good $44,362 |
| Uruguayans | 67.6 /100 | #155 | Good $44,318 |