Romanian vs Hungarian Per Capita Income
COMPARE
Romanian
Hungarian
Per Capita Income
Per Capita Income Comparison
Romanians
Hungarians
$48,445
PER CAPITA INCOME
99.5/ 100
METRIC RATING
79th/ 347
METRIC RANK
$45,426
PER CAPITA INCOME
87.9/ 100
METRIC RATING
135th/ 347
METRIC RANK
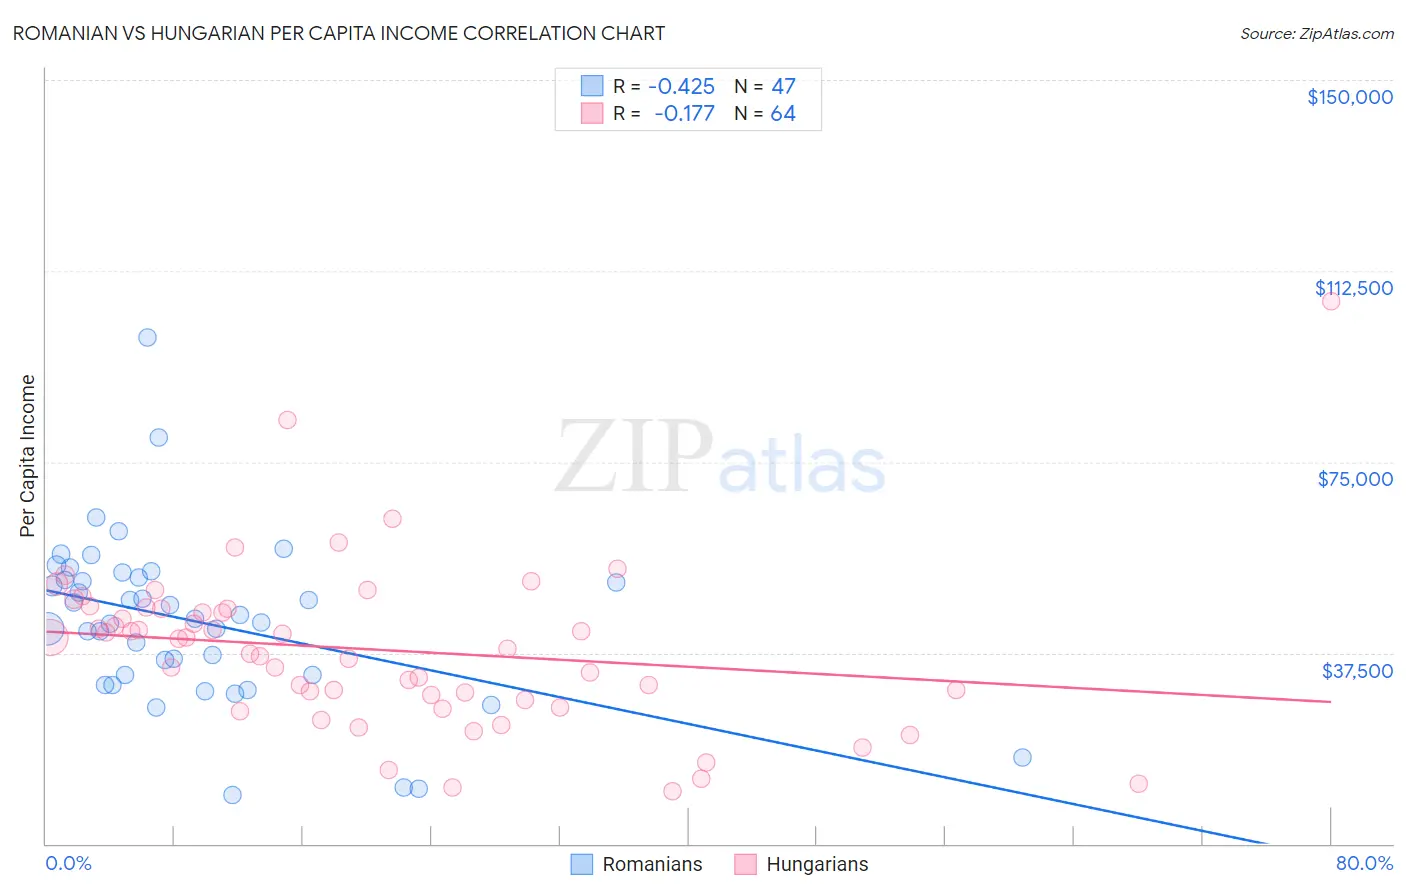
Romanian vs Hungarian Per Capita Income Correlation Chart
The statistical analysis conducted on geographies consisting of 377,926,432 people shows a moderate negative correlation between the proportion of Romanians and per capita income in the United States with a correlation coefficient (R) of -0.425 and weighted average of $48,445. Similarly, the statistical analysis conducted on geographies consisting of 486,270,132 people shows a poor negative correlation between the proportion of Hungarians and per capita income in the United States with a correlation coefficient (R) of -0.177 and weighted average of $45,426, a difference of 6.6%.
Per Capita Income Correlation Summary
| Measurement | Romanian | Hungarian |
| Minimum | $9,471 | $10,415 |
| Maximum | $99,396 | $106,430 |
| Range | $89,925 | $96,015 |
| Mean | $43,633 | $38,150 |
| Median | $44,159 | $39,313 |
| Interquartile 25% (IQ1) | $33,112 | $28,777 |
| Interquartile 75% (IQ3) | $52,383 | $46,125 |
| Interquartile Range (IQR) | $19,271 | $17,348 |
| Standard Deviation (Sample) | $16,424 | $16,236 |
| Standard Deviation (Population) | $16,248 | $16,109 |
Similar Demographics by Per Capita Income
Demographics Similar to Romanians by Per Capita Income
In terms of per capita income, the demographic groups most similar to Romanians are Egyptian ($48,358, a difference of 0.18%), Armenian ($48,287, a difference of 0.33%), Immigrants from Italy ($48,654, a difference of 0.43%), Immigrants from Indonesia ($48,195, a difference of 0.52%), and Immigrants from Brazil ($48,164, a difference of 0.58%).
| Demographics | Rating | Rank | Per Capita Income |
| Immigrants | Hungary | 99.8 /100 | #72 | Exceptional $49,303 |
| Immigrants | North America | 99.8 /100 | #73 | Exceptional $49,302 |
| Mongolians | 99.8 /100 | #74 | Exceptional $49,173 |
| Immigrants | Bolivia | 99.7 /100 | #75 | Exceptional $48,970 |
| Immigrants | England | 99.7 /100 | #76 | Exceptional $48,844 |
| Immigrants | Kazakhstan | 99.7 /100 | #77 | Exceptional $48,747 |
| Immigrants | Italy | 99.6 /100 | #78 | Exceptional $48,654 |
| Romanians | 99.5 /100 | #79 | Exceptional $48,445 |
| Egyptians | 99.5 /100 | #80 | Exceptional $48,358 |
| Armenians | 99.4 /100 | #81 | Exceptional $48,287 |
| Immigrants | Indonesia | 99.4 /100 | #82 | Exceptional $48,195 |
| Immigrants | Brazil | 99.4 /100 | #83 | Exceptional $48,164 |
| Immigrants | Ukraine | 99.3 /100 | #84 | Exceptional $48,134 |
| Austrians | 99.3 /100 | #85 | Exceptional $48,116 |
| Immigrants | Southern Europe | 99.3 /100 | #86 | Exceptional $48,027 |
Demographics Similar to Hungarians by Per Capita Income
In terms of per capita income, the demographic groups most similar to Hungarians are Slovene ($45,581, a difference of 0.34%), Pakistani ($45,587, a difference of 0.35%), Jordanian ($45,605, a difference of 0.39%), Immigrants from North Macedonia ($45,622, a difference of 0.43%), and Immigrants from Oceania ($45,220, a difference of 0.46%).
| Demographics | Rating | Rank | Per Capita Income |
| Swedes | 91.3 /100 | #128 | Exceptional $45,750 |
| Luxembourgers | 90.4 /100 | #129 | Exceptional $45,663 |
| Arabs | 90.4 /100 | #130 | Exceptional $45,662 |
| Immigrants | North Macedonia | 90.0 /100 | #131 | Exceptional $45,622 |
| Jordanians | 89.9 /100 | #132 | Excellent $45,605 |
| Pakistanis | 89.7 /100 | #133 | Excellent $45,587 |
| Slovenes | 89.6 /100 | #134 | Excellent $45,581 |
| Hungarians | 87.9 /100 | #135 | Excellent $45,426 |
| Immigrants | Oceania | 85.2 /100 | #136 | Excellent $45,220 |
| Immigrants | Syria | 85.2 /100 | #137 | Excellent $45,218 |
| Assyrians/Chaldeans/Syriacs | 84.8 /100 | #138 | Excellent $45,195 |
| Basques | 83.2 /100 | #139 | Excellent $45,086 |
| Immigrants | Jordan | 82.9 /100 | #140 | Excellent $45,066 |
| Slavs | 82.6 /100 | #141 | Excellent $45,049 |
| Ugandans | 82.6 /100 | #142 | Excellent $45,047 |