Pueblo vs Marshallese Householder Income Under 25 years
COMPARE
Pueblo
Marshallese
Householder Income Under 25 years
Householder Income Under 25 years Comparison
Pueblo
Marshallese
$45,018
HOUSEHOLDER INCOME UNDER 25 YEARS
0.0/ 100
METRIC RATING
337th/ 347
METRIC RANK
$50,627
HOUSEHOLDER INCOME UNDER 25 YEARS
2.1/ 100
METRIC RATING
244th/ 347
METRIC RANK
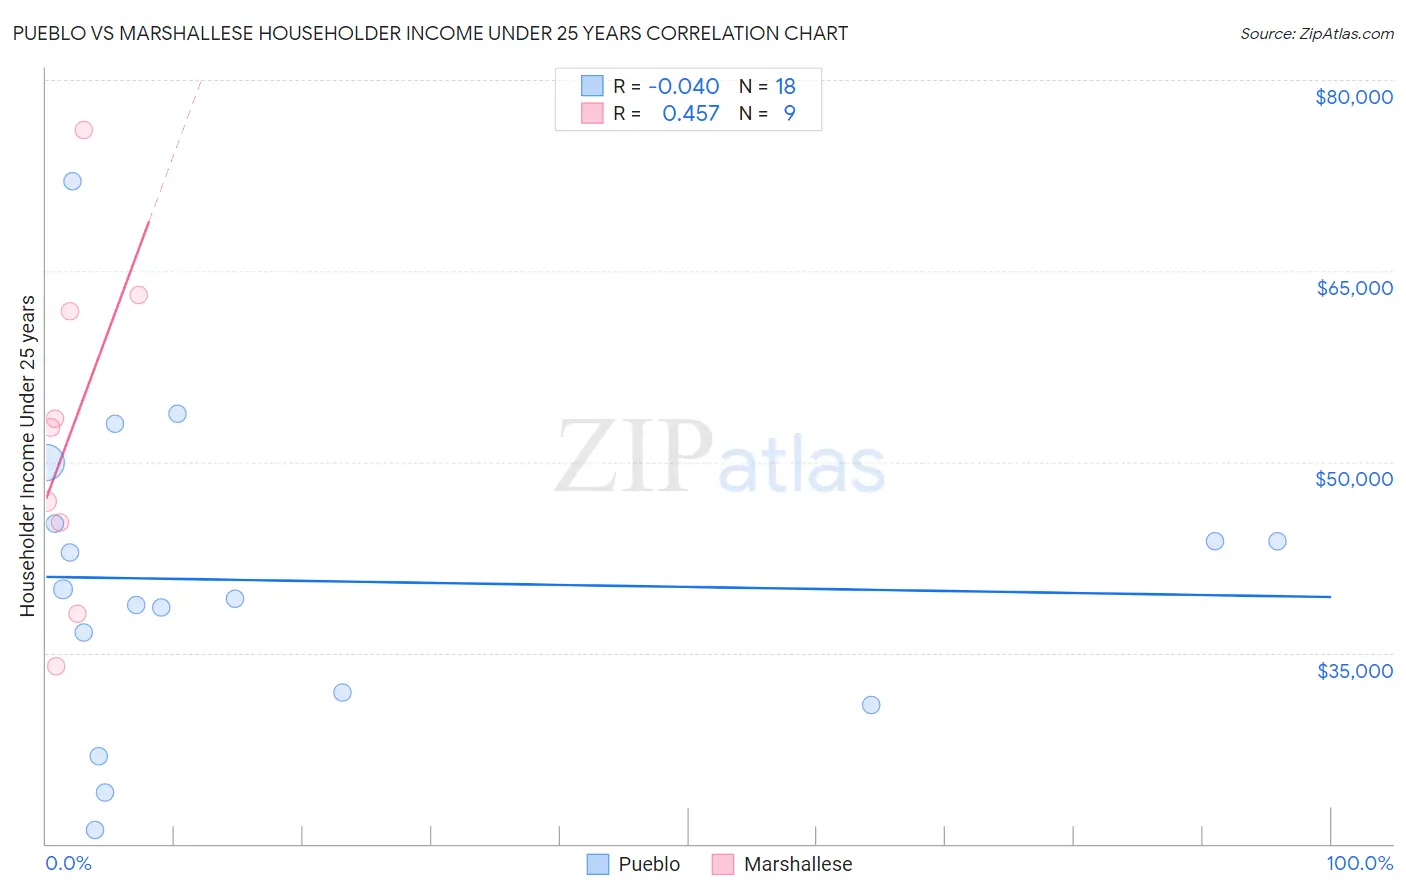
Pueblo vs Marshallese Householder Income Under 25 years Correlation Chart
The statistical analysis conducted on geographies consisting of 113,072,250 people shows no correlation between the proportion of Pueblo and household income with householder under the age of 25 in the United States with a correlation coefficient (R) of -0.040 and weighted average of $45,018. Similarly, the statistical analysis conducted on geographies consisting of 14,161,929 people shows a moderate positive correlation between the proportion of Marshallese and household income with householder under the age of 25 in the United States with a correlation coefficient (R) of 0.457 and weighted average of $50,627, a difference of 12.5%.
Householder Income Under 25 years Correlation Summary
| Measurement | Pueblo | Marshallese |
| Minimum | $21,071 | $33,972 |
| Maximum | $72,000 | $76,023 |
| Range | $50,929 | $42,051 |
| Mean | $40,668 | $52,361 |
| Median | $39,611 | $52,698 |
| Interquartile 25% (IQ1) | $31,875 | $41,668 |
| Interquartile 75% (IQ3) | $45,115 | $62,476 |
| Interquartile Range (IQR) | $13,240 | $20,807 |
| Standard Deviation (Sample) | $12,094 | $13,175 |
| Standard Deviation (Population) | $11,753 | $12,421 |
Similar Demographics by Householder Income Under 25 years
Demographics Similar to Pueblo by Householder Income Under 25 years
In terms of householder income under 25 years, the demographic groups most similar to Pueblo are Tohono O'odham ($45,248, a difference of 0.51%), Cheyenne ($45,275, a difference of 0.57%), Chickasaw ($44,763, a difference of 0.57%), Kiowa ($44,733, a difference of 0.64%), and Cajun ($45,338, a difference of 0.71%).
| Demographics | Rating | Rank | Householder Income Under 25 years |
| Indonesians | 0.0 /100 | #330 | Tragic $45,566 |
| Immigrants | Zaire | 0.0 /100 | #331 | Tragic $45,529 |
| Choctaw | 0.0 /100 | #332 | Tragic $45,450 |
| Creek | 0.0 /100 | #333 | Tragic $45,371 |
| Cajuns | 0.0 /100 | #334 | Tragic $45,338 |
| Cheyenne | 0.0 /100 | #335 | Tragic $45,275 |
| Tohono O'odham | 0.0 /100 | #336 | Tragic $45,248 |
| Pueblo | 0.0 /100 | #337 | Tragic $45,018 |
| Chickasaw | 0.0 /100 | #338 | Tragic $44,763 |
| Kiowa | 0.0 /100 | #339 | Tragic $44,733 |
| Blacks/African Americans | 0.0 /100 | #340 | Tragic $44,381 |
| Houma | 0.0 /100 | #341 | Tragic $44,356 |
| Arapaho | 0.0 /100 | #342 | Tragic $44,003 |
| Immigrants | Yemen | 0.0 /100 | #343 | Tragic $43,591 |
| Immigrants | Congo | 0.0 /100 | #344 | Tragic $43,266 |
Demographics Similar to Marshallese by Householder Income Under 25 years
In terms of householder income under 25 years, the demographic groups most similar to Marshallese are Immigrants from Thailand ($50,645, a difference of 0.040%), Immigrants from Africa ($50,609, a difference of 0.040%), Cuban ($50,655, a difference of 0.060%), Welsh ($50,597, a difference of 0.060%), and Immigrants from Micronesia ($50,691, a difference of 0.12%).
| Demographics | Rating | Rank | Householder Income Under 25 years |
| Germans | 3.3 /100 | #237 | Tragic $50,804 |
| Iraqis | 3.2 /100 | #238 | Tragic $50,802 |
| Immigrants | Caribbean | 2.9 /100 | #239 | Tragic $50,757 |
| Immigrants | Lebanon | 2.7 /100 | #240 | Tragic $50,729 |
| Immigrants | Micronesia | 2.5 /100 | #241 | Tragic $50,691 |
| Cubans | 2.3 /100 | #242 | Tragic $50,655 |
| Immigrants | Thailand | 2.2 /100 | #243 | Tragic $50,645 |
| Marshallese | 2.1 /100 | #244 | Tragic $50,627 |
| Immigrants | Africa | 2.0 /100 | #245 | Tragic $50,609 |
| Welsh | 2.0 /100 | #246 | Tragic $50,597 |
| Immigrants | Bosnia and Herzegovina | 1.8 /100 | #247 | Tragic $50,565 |
| Slavs | 1.8 /100 | #248 | Tragic $50,563 |
| Scottish | 1.8 /100 | #249 | Tragic $50,554 |
| Immigrants | Cabo Verde | 1.7 /100 | #250 | Tragic $50,520 |
| Celtics | 1.4 /100 | #251 | Tragic $50,447 |