Pueblo vs Immigrants from Senegal Householder Income Under 25 years
COMPARE
Pueblo
Immigrants from Senegal
Householder Income Under 25 years
Householder Income Under 25 years Comparison
Pueblo
Immigrants from Senegal
$45,018
HOUSEHOLDER INCOME UNDER 25 YEARS
0.0/ 100
METRIC RATING
337th/ 347
METRIC RANK
$49,742
HOUSEHOLDER INCOME UNDER 25 YEARS
0.3/ 100
METRIC RATING
274th/ 347
METRIC RANK
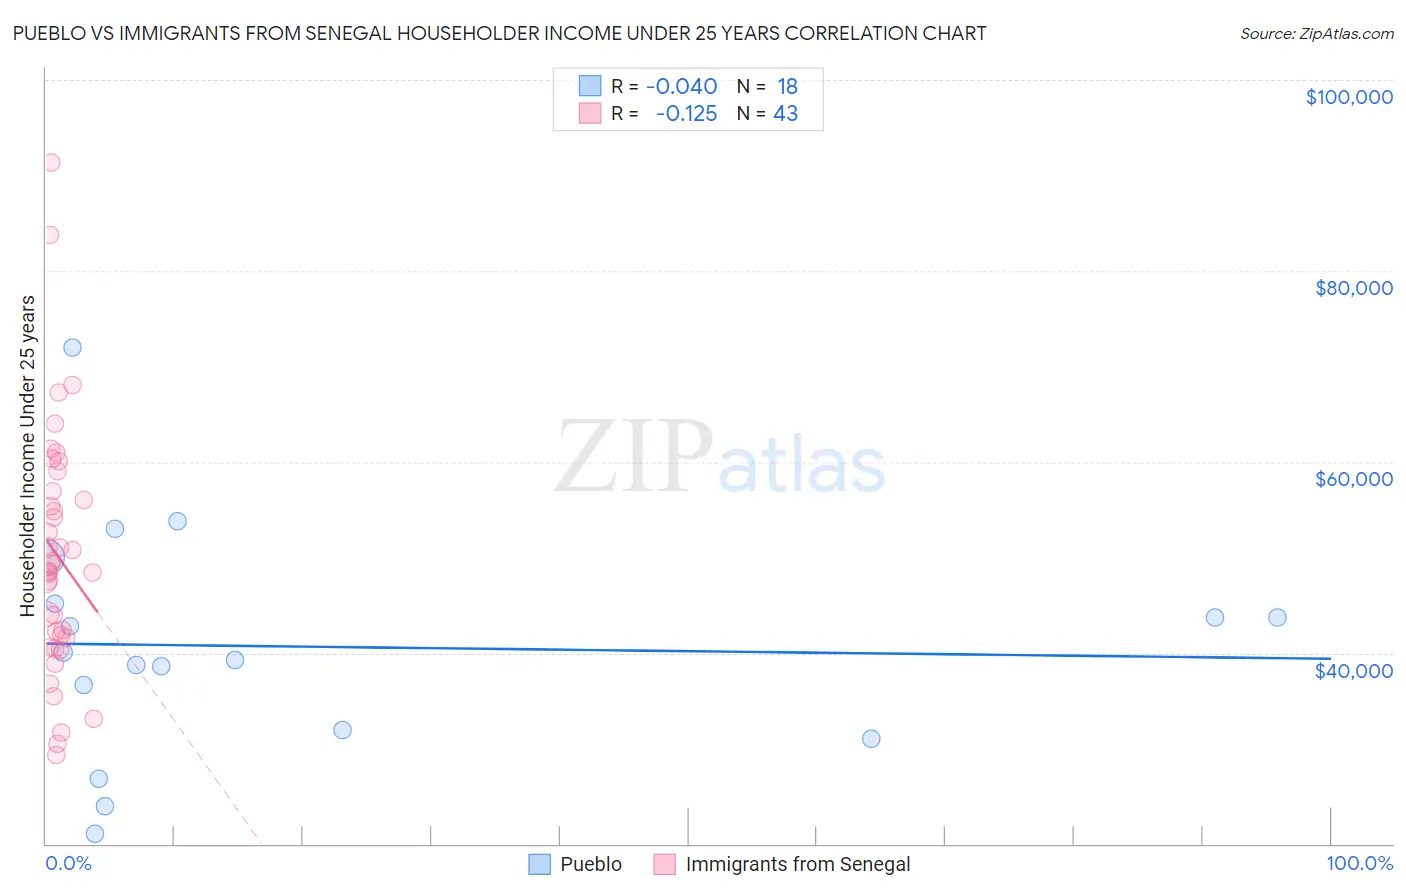
Pueblo vs Immigrants from Senegal Householder Income Under 25 years Correlation Chart
The statistical analysis conducted on geographies consisting of 113,072,250 people shows no correlation between the proportion of Pueblo and household income with householder under the age of 25 in the United States with a correlation coefficient (R) of -0.040 and weighted average of $45,018. Similarly, the statistical analysis conducted on geographies consisting of 85,448,384 people shows a poor negative correlation between the proportion of Immigrants from Senegal and household income with householder under the age of 25 in the United States with a correlation coefficient (R) of -0.125 and weighted average of $49,742, a difference of 10.5%.
Householder Income Under 25 years Correlation Summary
| Measurement | Pueblo | Immigrants from Senegal |
| Minimum | $21,071 | $29,259 |
| Maximum | $72,000 | $91,404 |
| Range | $50,929 | $62,145 |
| Mean | $40,668 | $50,222 |
| Median | $39,611 | $48,557 |
| Interquartile 25% (IQ1) | $31,875 | $41,620 |
| Interquartile 75% (IQ3) | $45,115 | $56,900 |
| Interquartile Range (IQR) | $13,240 | $15,280 |
| Standard Deviation (Sample) | $12,094 | $12,847 |
| Standard Deviation (Population) | $11,753 | $12,697 |
Similar Demographics by Householder Income Under 25 years
Demographics Similar to Pueblo by Householder Income Under 25 years
In terms of householder income under 25 years, the demographic groups most similar to Pueblo are Tohono O'odham ($45,248, a difference of 0.51%), Cheyenne ($45,275, a difference of 0.57%), Chickasaw ($44,763, a difference of 0.57%), Kiowa ($44,733, a difference of 0.64%), and Cajun ($45,338, a difference of 0.71%).
| Demographics | Rating | Rank | Householder Income Under 25 years |
| Indonesians | 0.0 /100 | #330 | Tragic $45,566 |
| Immigrants | Zaire | 0.0 /100 | #331 | Tragic $45,529 |
| Choctaw | 0.0 /100 | #332 | Tragic $45,450 |
| Creek | 0.0 /100 | #333 | Tragic $45,371 |
| Cajuns | 0.0 /100 | #334 | Tragic $45,338 |
| Cheyenne | 0.0 /100 | #335 | Tragic $45,275 |
| Tohono O'odham | 0.0 /100 | #336 | Tragic $45,248 |
| Pueblo | 0.0 /100 | #337 | Tragic $45,018 |
| Chickasaw | 0.0 /100 | #338 | Tragic $44,763 |
| Kiowa | 0.0 /100 | #339 | Tragic $44,733 |
| Blacks/African Americans | 0.0 /100 | #340 | Tragic $44,381 |
| Houma | 0.0 /100 | #341 | Tragic $44,356 |
| Arapaho | 0.0 /100 | #342 | Tragic $44,003 |
| Immigrants | Yemen | 0.0 /100 | #343 | Tragic $43,591 |
| Immigrants | Congo | 0.0 /100 | #344 | Tragic $43,266 |
Demographics Similar to Immigrants from Senegal by Householder Income Under 25 years
In terms of householder income under 25 years, the demographic groups most similar to Immigrants from Senegal are Slovak ($49,753, a difference of 0.020%), Colville ($49,774, a difference of 0.060%), Taiwanese ($49,804, a difference of 0.12%), Immigrants from Kenya ($49,633, a difference of 0.22%), and Dominican ($49,633, a difference of 0.22%).
| Demographics | Rating | Rank | Householder Income Under 25 years |
| Immigrants | Laos | 0.5 /100 | #267 | Tragic $50,041 |
| Venezuelans | 0.5 /100 | #268 | Tragic $50,011 |
| Ute | 0.5 /100 | #269 | Tragic $49,997 |
| Mexicans | 0.5 /100 | #270 | Tragic $49,989 |
| Taiwanese | 0.3 /100 | #271 | Tragic $49,804 |
| Colville | 0.3 /100 | #272 | Tragic $49,774 |
| Slovaks | 0.3 /100 | #273 | Tragic $49,753 |
| Immigrants | Senegal | 0.3 /100 | #274 | Tragic $49,742 |
| Immigrants | Kenya | 0.2 /100 | #275 | Tragic $49,633 |
| Dominicans | 0.2 /100 | #276 | Tragic $49,633 |
| Immigrants | Western Africa | 0.2 /100 | #277 | Tragic $49,621 |
| Nigerians | 0.1 /100 | #278 | Tragic $49,416 |
| Apache | 0.1 /100 | #279 | Tragic $49,395 |
| Hmong | 0.1 /100 | #280 | Tragic $49,364 |
| Immigrants | Nonimmigrants | 0.1 /100 | #281 | Tragic $49,348 |