Pima vs Sierra Leonean Median Female Earnings
COMPARE
Pima
Sierra Leonean
Median Female Earnings
Median Female Earnings Comparison
Pima
Sierra Leoneans
$35,326
MEDIAN FEMALE EARNINGS
0.0/ 100
METRIC RATING
301st/ 347
METRIC RANK
$42,868
MEDIAN FEMALE EARNINGS
99.9/ 100
METRIC RATING
65th/ 347
METRIC RANK
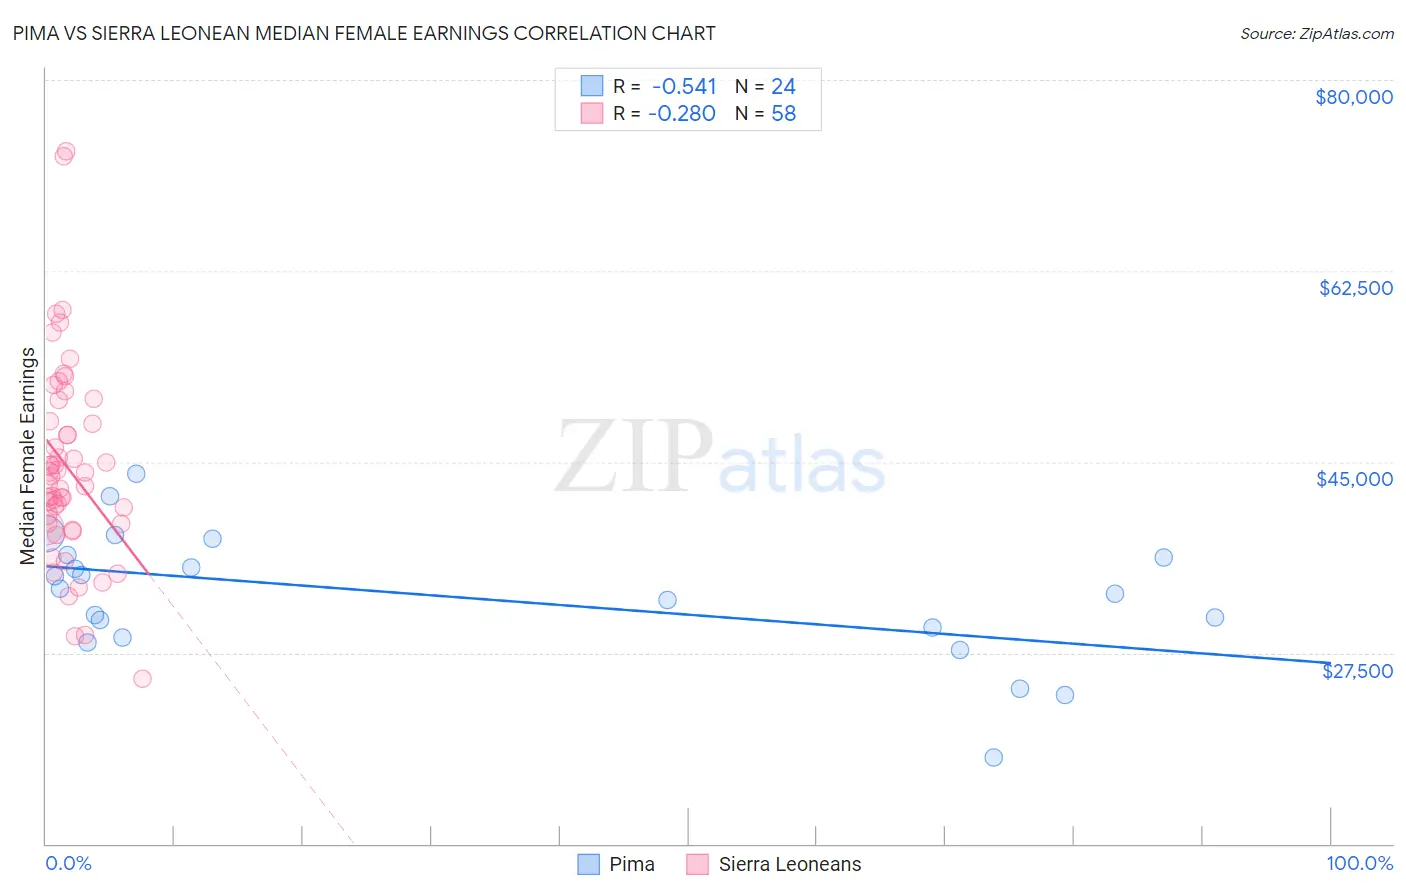
Pima vs Sierra Leonean Median Female Earnings Correlation Chart
The statistical analysis conducted on geographies consisting of 61,524,471 people shows a substantial negative correlation between the proportion of Pima and median female earnings in the United States with a correlation coefficient (R) of -0.541 and weighted average of $35,326. Similarly, the statistical analysis conducted on geographies consisting of 83,345,835 people shows a weak negative correlation between the proportion of Sierra Leoneans and median female earnings in the United States with a correlation coefficient (R) of -0.280 and weighted average of $42,868, a difference of 21.3%.
Median Female Earnings Correlation Summary
| Measurement | Pima | Sierra Leonean |
| Minimum | $17,917 | $25,167 |
| Maximum | $43,952 | $73,523 |
| Range | $26,035 | $48,356 |
| Mean | $32,676 | $44,483 |
| Median | $33,171 | $43,304 |
| Interquartile 25% (IQ1) | $29,398 | $39,290 |
| Interquartile 75% (IQ3) | $36,333 | $48,705 |
| Interquartile Range (IQR) | $6,935 | $9,415 |
| Standard Deviation (Sample) | $5,900 | $9,174 |
| Standard Deviation (Population) | $5,776 | $9,094 |
Similar Demographics by Median Female Earnings
Demographics Similar to Pima by Median Female Earnings
In terms of median female earnings, the demographic groups most similar to Pima are Black/African American ($35,315, a difference of 0.030%), Immigrants from Latin America ($35,307, a difference of 0.050%), Yuman ($35,377, a difference of 0.14%), Crow ($35,266, a difference of 0.17%), and Immigrants from Guatemala ($35,444, a difference of 0.33%).
| Demographics | Rating | Rank | Median Female Earnings |
| Cheyenne | 0.0 /100 | #294 | Tragic $35,673 |
| Comanche | 0.0 /100 | #295 | Tragic $35,661 |
| Mexican American Indians | 0.0 /100 | #296 | Tragic $35,629 |
| Hmong | 0.0 /100 | #297 | Tragic $35,498 |
| Immigrants | Micronesia | 0.0 /100 | #298 | Tragic $35,477 |
| Immigrants | Guatemala | 0.0 /100 | #299 | Tragic $35,444 |
| Yuman | 0.0 /100 | #300 | Tragic $35,377 |
| Pima | 0.0 /100 | #301 | Tragic $35,326 |
| Blacks/African Americans | 0.0 /100 | #302 | Tragic $35,315 |
| Immigrants | Latin America | 0.0 /100 | #303 | Tragic $35,307 |
| Crow | 0.0 /100 | #304 | Tragic $35,266 |
| Bahamians | 0.0 /100 | #305 | Tragic $35,125 |
| Fijians | 0.0 /100 | #306 | Tragic $35,114 |
| Sioux | 0.0 /100 | #307 | Tragic $35,063 |
| Immigrants | Bahamas | 0.0 /100 | #308 | Tragic $35,027 |
Demographics Similar to Sierra Leoneans by Median Female Earnings
In terms of median female earnings, the demographic groups most similar to Sierra Leoneans are Immigrants from Norway ($42,837, a difference of 0.070%), Immigrants from Egypt ($42,837, a difference of 0.070%), Immigrants from Austria ($42,824, a difference of 0.10%), Immigrants from Spain ($42,815, a difference of 0.12%), and Immigrants from Ethiopia ($42,744, a difference of 0.29%).
| Demographics | Rating | Rank | Median Female Earnings |
| Paraguayans | 99.9 /100 | #58 | Exceptional $43,173 |
| Estonians | 99.9 /100 | #59 | Exceptional $43,106 |
| Immigrants | Latvia | 99.9 /100 | #60 | Exceptional $43,099 |
| Immigrants | Bulgaria | 99.9 /100 | #61 | Exceptional $43,085 |
| Afghans | 99.9 /100 | #62 | Exceptional $43,077 |
| Immigrants | Ukraine | 99.9 /100 | #63 | Exceptional $43,069 |
| Immigrants | Pakistan | 99.9 /100 | #64 | Exceptional $43,052 |
| Sierra Leoneans | 99.9 /100 | #65 | Exceptional $42,868 |
| Immigrants | Norway | 99.9 /100 | #66 | Exceptional $42,837 |
| Immigrants | Egypt | 99.9 /100 | #67 | Exceptional $42,837 |
| Immigrants | Austria | 99.8 /100 | #68 | Exceptional $42,824 |
| Immigrants | Spain | 99.8 /100 | #69 | Exceptional $42,815 |
| Immigrants | Ethiopia | 99.8 /100 | #70 | Exceptional $42,744 |
| Immigrants | Romania | 99.8 /100 | #71 | Exceptional $42,718 |
| Albanians | 99.8 /100 | #72 | Exceptional $42,584 |