Pima vs Puget Sound Salish Median Female Earnings
COMPARE
Pima
Puget Sound Salish
Median Female Earnings
Median Female Earnings Comparison
Pima
Puget Sound Salish
$35,326
MEDIAN FEMALE EARNINGS
0.0/ 100
METRIC RATING
301st/ 347
METRIC RANK
$39,376
MEDIAN FEMALE EARNINGS
33.9/ 100
METRIC RATING
190th/ 347
METRIC RANK
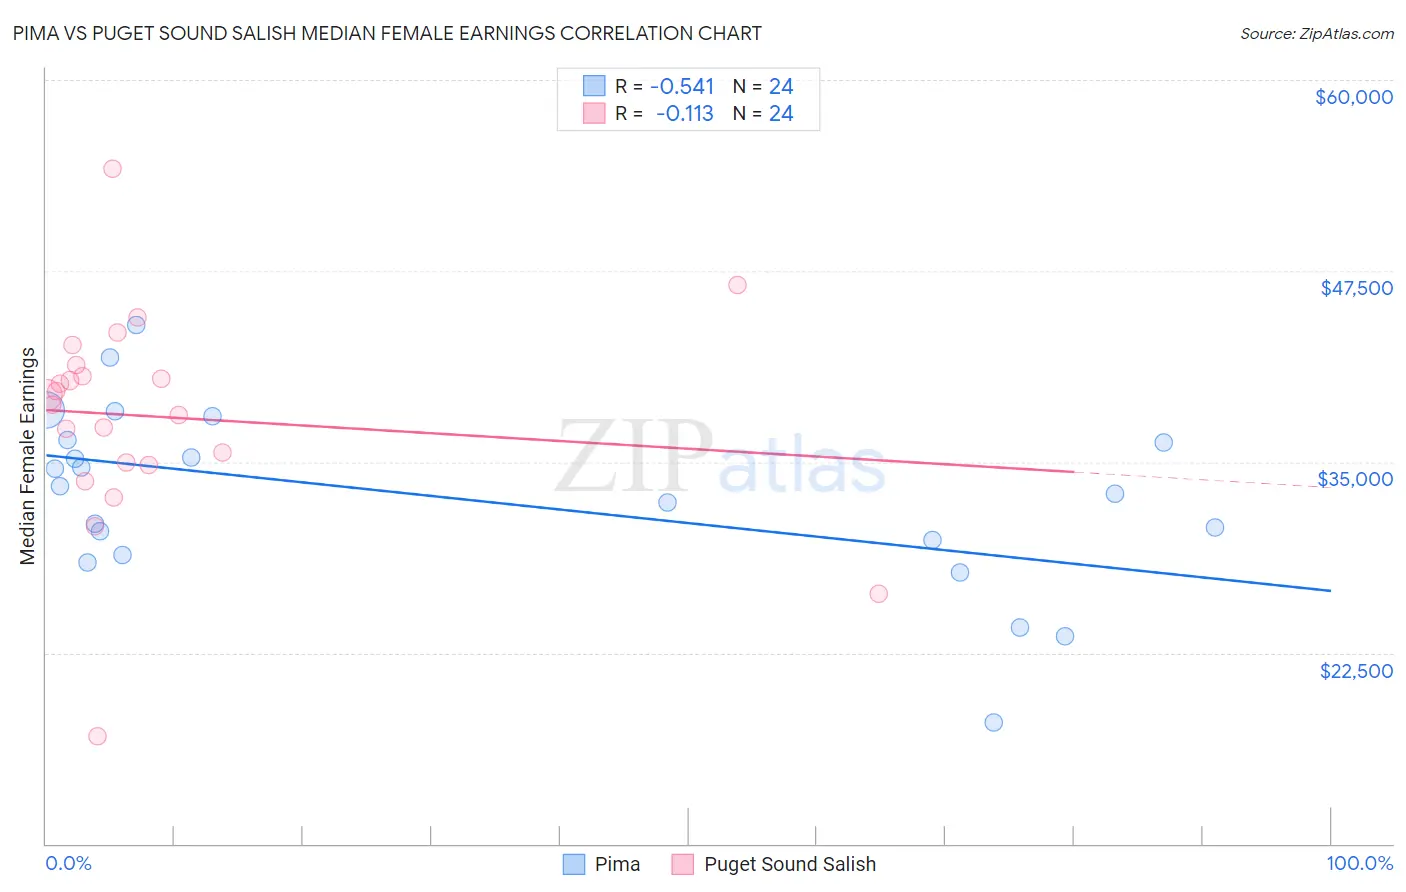
Pima vs Puget Sound Salish Median Female Earnings Correlation Chart
The statistical analysis conducted on geographies consisting of 61,524,471 people shows a substantial negative correlation between the proportion of Pima and median female earnings in the United States with a correlation coefficient (R) of -0.541 and weighted average of $35,326. Similarly, the statistical analysis conducted on geographies consisting of 46,146,789 people shows a poor negative correlation between the proportion of Puget Sound Salish and median female earnings in the United States with a correlation coefficient (R) of -0.113 and weighted average of $39,376, a difference of 11.5%.
Median Female Earnings Correlation Summary
| Measurement | Pima | Puget Sound Salish |
| Minimum | $17,917 | $17,028 |
| Maximum | $43,952 | $54,167 |
| Range | $26,035 | $37,139 |
| Mean | $32,676 | $37,933 |
| Median | $33,171 | $39,067 |
| Interquartile 25% (IQ1) | $29,398 | $34,884 |
| Interquartile 75% (IQ3) | $36,333 | $40,976 |
| Interquartile Range (IQR) | $6,935 | $6,092 |
| Standard Deviation (Sample) | $5,900 | $7,122 |
| Standard Deviation (Population) | $5,776 | $6,972 |
Similar Demographics by Median Female Earnings
Demographics Similar to Pima by Median Female Earnings
In terms of median female earnings, the demographic groups most similar to Pima are Black/African American ($35,315, a difference of 0.030%), Immigrants from Latin America ($35,307, a difference of 0.050%), Yuman ($35,377, a difference of 0.14%), Crow ($35,266, a difference of 0.17%), and Immigrants from Guatemala ($35,444, a difference of 0.33%).
| Demographics | Rating | Rank | Median Female Earnings |
| Cheyenne | 0.0 /100 | #294 | Tragic $35,673 |
| Comanche | 0.0 /100 | #295 | Tragic $35,661 |
| Mexican American Indians | 0.0 /100 | #296 | Tragic $35,629 |
| Hmong | 0.0 /100 | #297 | Tragic $35,498 |
| Immigrants | Micronesia | 0.0 /100 | #298 | Tragic $35,477 |
| Immigrants | Guatemala | 0.0 /100 | #299 | Tragic $35,444 |
| Yuman | 0.0 /100 | #300 | Tragic $35,377 |
| Pima | 0.0 /100 | #301 | Tragic $35,326 |
| Blacks/African Americans | 0.0 /100 | #302 | Tragic $35,315 |
| Immigrants | Latin America | 0.0 /100 | #303 | Tragic $35,307 |
| Crow | 0.0 /100 | #304 | Tragic $35,266 |
| Bahamians | 0.0 /100 | #305 | Tragic $35,125 |
| Fijians | 0.0 /100 | #306 | Tragic $35,114 |
| Sioux | 0.0 /100 | #307 | Tragic $35,063 |
| Immigrants | Bahamas | 0.0 /100 | #308 | Tragic $35,027 |
Demographics Similar to Puget Sound Salish by Median Female Earnings
In terms of median female earnings, the demographic groups most similar to Puget Sound Salish are Senegalese ($39,384, a difference of 0.020%), Immigrants from Western Africa ($39,351, a difference of 0.060%), Swedish ($39,421, a difference of 0.11%), Bermudan ($39,418, a difference of 0.11%), and Immigrants ($39,328, a difference of 0.12%).
| Demographics | Rating | Rank | Median Female Earnings |
| Hungarians | 40.3 /100 | #183 | Average $39,510 |
| Europeans | 37.7 /100 | #184 | Fair $39,457 |
| Immigrants | West Indies | 36.9 /100 | #185 | Fair $39,441 |
| Colombians | 36.9 /100 | #186 | Fair $39,439 |
| Swedes | 36.0 /100 | #187 | Fair $39,421 |
| Bermudans | 35.9 /100 | #188 | Fair $39,418 |
| Senegalese | 34.2 /100 | #189 | Fair $39,384 |
| Puget Sound Salish | 33.9 /100 | #190 | Fair $39,376 |
| Immigrants | Western Africa | 32.7 /100 | #191 | Fair $39,351 |
| Immigrants | Immigrants | 31.7 /100 | #192 | Fair $39,328 |
| Immigrants | Nigeria | 30.2 /100 | #193 | Fair $39,294 |
| Irish | 30.0 /100 | #194 | Fair $39,291 |
| Uruguayans | 27.3 /100 | #195 | Fair $39,228 |
| Immigrants | Costa Rica | 25.6 /100 | #196 | Fair $39,186 |
| Assyrians/Chaldeans/Syriacs | 24.6 /100 | #197 | Fair $39,159 |