Pima vs Guamanian/Chamorro Median Family Income
COMPARE
Pima
Guamanian/Chamorro
Median Family Income
Median Family Income Comparison
Pima
Guamanians/Chamorros
$77,431
MEDIAN FAMILY INCOME
0.0/ 100
METRIC RATING
339th/ 347
METRIC RANK
$101,061
MEDIAN FAMILY INCOME
30.5/ 100
METRIC RATING
188th/ 347
METRIC RANK
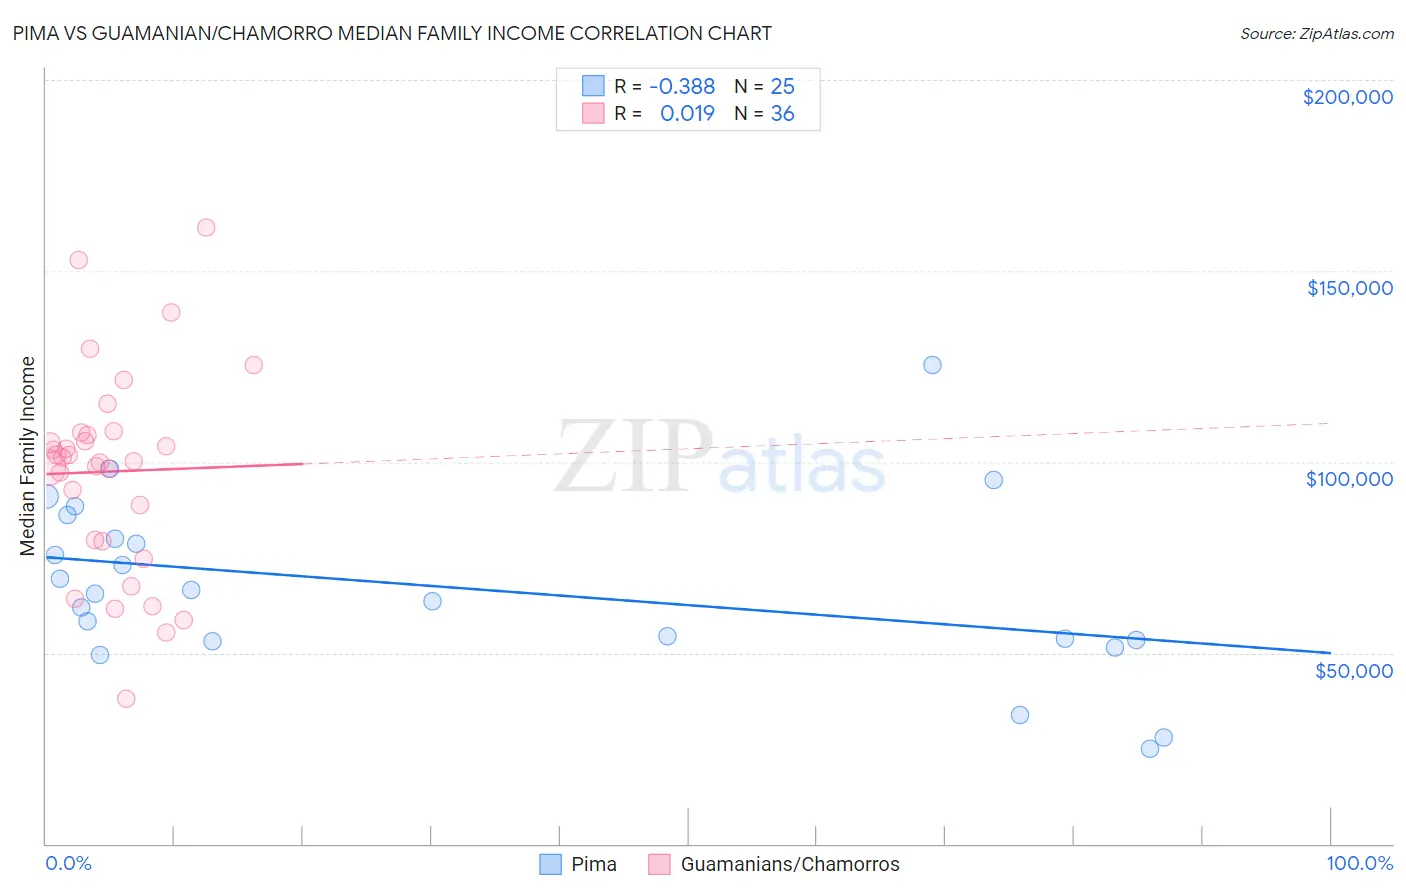
Pima vs Guamanian/Chamorro Median Family Income Correlation Chart
The statistical analysis conducted on geographies consisting of 61,529,758 people shows a mild negative correlation between the proportion of Pima and median family income in the United States with a correlation coefficient (R) of -0.388 and weighted average of $77,431. Similarly, the statistical analysis conducted on geographies consisting of 221,859,912 people shows no correlation between the proportion of Guamanians/Chamorros and median family income in the United States with a correlation coefficient (R) of 0.019 and weighted average of $101,061, a difference of 30.5%.
Median Family Income Correlation Summary
| Measurement | Pima | Guamanian/Chamorro |
| Minimum | $24,821 | $37,991 |
| Maximum | $125,278 | $161,250 |
| Range | $100,457 | $123,259 |
| Mean | $67,157 | $97,460 |
| Median | $65,417 | $100,672 |
| Interquartile 25% (IQ1) | $53,298 | $79,398 |
| Interquartile 75% (IQ3) | $83,045 | $107,355 |
| Interquartile Range (IQR) | $29,747 | $27,957 |
| Standard Deviation (Sample) | $23,070 | $26,595 |
| Standard Deviation (Population) | $22,604 | $26,223 |
Similar Demographics by Median Family Income
Demographics Similar to Pima by Median Family Income
In terms of median family income, the demographic groups most similar to Pima are Immigrants from Yemen ($77,457, a difference of 0.030%), Hopi ($77,188, a difference of 0.32%), Pueblo ($76,880, a difference of 0.72%), Yuman ($78,055, a difference of 0.80%), and Immigrants from Cuba ($78,249, a difference of 1.1%).
| Demographics | Rating | Rank | Median Family Income |
| Natives/Alaskans | 0.0 /100 | #332 | Tragic $80,908 |
| Kiowa | 0.0 /100 | #333 | Tragic $80,885 |
| Menominee | 0.0 /100 | #334 | Tragic $79,563 |
| Yup'ik | 0.0 /100 | #335 | Tragic $79,290 |
| Immigrants | Cuba | 0.0 /100 | #336 | Tragic $78,249 |
| Yuman | 0.0 /100 | #337 | Tragic $78,055 |
| Immigrants | Yemen | 0.0 /100 | #338 | Tragic $77,457 |
| Pima | 0.0 /100 | #339 | Tragic $77,431 |
| Hopi | 0.0 /100 | #340 | Tragic $77,188 |
| Pueblo | 0.0 /100 | #341 | Tragic $76,880 |
| Crow | 0.0 /100 | #342 | Tragic $76,605 |
| Houma | 0.0 /100 | #343 | Tragic $76,188 |
| Tohono O'odham | 0.0 /100 | #344 | Tragic $72,193 |
| Navajo | 0.0 /100 | #345 | Tragic $70,989 |
| Puerto Ricans | 0.0 /100 | #346 | Tragic $70,423 |
Demographics Similar to Guamanians/Chamorros by Median Family Income
In terms of median family income, the demographic groups most similar to Guamanians/Chamorros are Tlingit-Haida ($101,092, a difference of 0.030%), Celtic ($101,139, a difference of 0.080%), Immigrants from Portugal ($100,984, a difference of 0.080%), Immigrants ($100,962, a difference of 0.10%), and Dutch ($101,192, a difference of 0.13%).
| Demographics | Rating | Rank | Median Family Income |
| Spaniards | 36.8 /100 | #181 | Fair $101,617 |
| Tsimshian | 35.9 /100 | #182 | Fair $101,543 |
| Kenyans | 34.5 /100 | #183 | Fair $101,417 |
| Immigrants | Costa Rica | 33.7 /100 | #184 | Fair $101,354 |
| Dutch | 31.9 /100 | #185 | Fair $101,192 |
| Celtics | 31.3 /100 | #186 | Fair $101,139 |
| Tlingit-Haida | 30.8 /100 | #187 | Fair $101,092 |
| Guamanians/Chamorros | 30.5 /100 | #188 | Fair $101,061 |
| Immigrants | Portugal | 29.6 /100 | #189 | Fair $100,984 |
| Immigrants | Immigrants | 29.4 /100 | #190 | Fair $100,962 |
| Colombians | 27.2 /100 | #191 | Fair $100,750 |
| Immigrants | Kenya | 26.5 /100 | #192 | Fair $100,679 |
| Iraqis | 26.3 /100 | #193 | Fair $100,658 |
| Uruguayans | 26.3 /100 | #194 | Fair $100,656 |
| Immigrants | South America | 23.9 /100 | #195 | Fair $100,414 |