Pakistani vs Shoshone Per Capita Income
COMPARE
Pakistani
Shoshone
Per Capita Income
Per Capita Income Comparison
Pakistanis
Shoshone
$45,587
PER CAPITA INCOME
89.7/ 100
METRIC RATING
133rd/ 347
METRIC RANK
$37,072
PER CAPITA INCOME
0.1/ 100
METRIC RATING
302nd/ 347
METRIC RANK
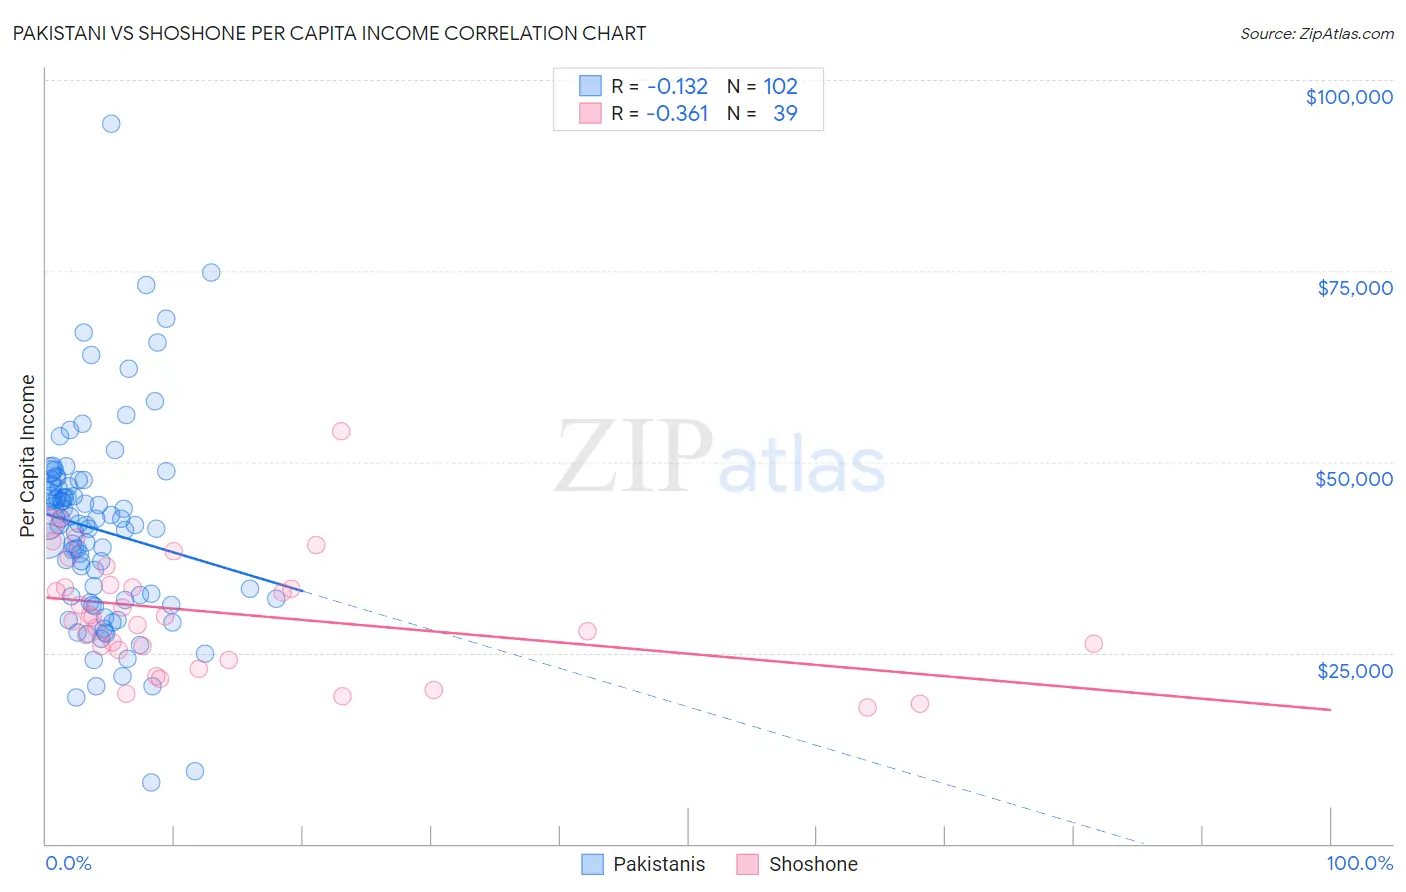
Pakistani vs Shoshone Per Capita Income Correlation Chart
The statistical analysis conducted on geographies consisting of 335,371,609 people shows a poor negative correlation between the proportion of Pakistanis and per capita income in the United States with a correlation coefficient (R) of -0.132 and weighted average of $45,587. Similarly, the statistical analysis conducted on geographies consisting of 66,627,177 people shows a mild negative correlation between the proportion of Shoshone and per capita income in the United States with a correlation coefficient (R) of -0.361 and weighted average of $37,072, a difference of 23.0%.
Per Capita Income Correlation Summary
| Measurement | Pakistani | Shoshone |
| Minimum | $8,026 | $17,814 |
| Maximum | $94,275 | $54,019 |
| Range | $86,249 | $36,205 |
| Mean | $41,080 | $30,204 |
| Median | $41,744 | $29,691 |
| Interquartile 25% (IQ1) | $31,965 | $25,299 |
| Interquartile 75% (IQ3) | $46,855 | $33,868 |
| Interquartile Range (IQR) | $14,890 | $8,569 |
| Standard Deviation (Sample) | $13,251 | $7,800 |
| Standard Deviation (Population) | $13,186 | $7,700 |
Similar Demographics by Per Capita Income
Demographics Similar to Pakistanis by Per Capita Income
In terms of per capita income, the demographic groups most similar to Pakistanis are Slovene ($45,581, a difference of 0.010%), Jordanian ($45,605, a difference of 0.040%), Immigrants from North Macedonia ($45,622, a difference of 0.080%), Arab ($45,662, a difference of 0.16%), and Luxembourger ($45,663, a difference of 0.17%).
| Demographics | Rating | Rank | Per Capita Income |
| Palestinians | 91.6 /100 | #126 | Exceptional $45,790 |
| Immigrants | Germany | 91.3 /100 | #127 | Exceptional $45,751 |
| Swedes | 91.3 /100 | #128 | Exceptional $45,750 |
| Luxembourgers | 90.4 /100 | #129 | Exceptional $45,663 |
| Arabs | 90.4 /100 | #130 | Exceptional $45,662 |
| Immigrants | North Macedonia | 90.0 /100 | #131 | Exceptional $45,622 |
| Jordanians | 89.9 /100 | #132 | Excellent $45,605 |
| Pakistanis | 89.7 /100 | #133 | Excellent $45,587 |
| Slovenes | 89.6 /100 | #134 | Excellent $45,581 |
| Hungarians | 87.9 /100 | #135 | Excellent $45,426 |
| Immigrants | Oceania | 85.2 /100 | #136 | Excellent $45,220 |
| Immigrants | Syria | 85.2 /100 | #137 | Excellent $45,218 |
| Assyrians/Chaldeans/Syriacs | 84.8 /100 | #138 | Excellent $45,195 |
| Basques | 83.2 /100 | #139 | Excellent $45,086 |
| Immigrants | Jordan | 82.9 /100 | #140 | Excellent $45,066 |
Demographics Similar to Shoshone by Per Capita Income
In terms of per capita income, the demographic groups most similar to Shoshone are Paiute ($37,066, a difference of 0.020%), Ottawa ($37,101, a difference of 0.080%), Honduran ($37,031, a difference of 0.11%), Inupiat ($36,999, a difference of 0.20%), and Immigrants from Bahamas ($37,193, a difference of 0.33%).
| Demographics | Rating | Rank | Per Capita Income |
| Immigrants | Dominican Republic | 0.1 /100 | #295 | Tragic $37,306 |
| Indonesians | 0.1 /100 | #296 | Tragic $37,300 |
| Haitians | 0.1 /100 | #297 | Tragic $37,289 |
| Immigrants | Caribbean | 0.1 /100 | #298 | Tragic $37,254 |
| Cherokee | 0.1 /100 | #299 | Tragic $37,203 |
| Immigrants | Bahamas | 0.1 /100 | #300 | Tragic $37,193 |
| Ottawa | 0.1 /100 | #301 | Tragic $37,101 |
| Shoshone | 0.1 /100 | #302 | Tragic $37,072 |
| Paiute | 0.1 /100 | #303 | Tragic $37,066 |
| Hondurans | 0.1 /100 | #304 | Tragic $37,031 |
| Inupiat | 0.1 /100 | #305 | Tragic $36,999 |
| Immigrants | Haiti | 0.0 /100 | #306 | Tragic $36,849 |
| Immigrants | Latin America | 0.0 /100 | #307 | Tragic $36,823 |
| Fijians | 0.0 /100 | #308 | Tragic $36,690 |
| Immigrants | Honduras | 0.0 /100 | #309 | Tragic $36,665 |