Pakistani vs Immigrants from Jamaica Per Capita Income
COMPARE
Pakistani
Immigrants from Jamaica
Per Capita Income
Per Capita Income Comparison
Pakistanis
Immigrants from Jamaica
$45,587
PER CAPITA INCOME
89.7/ 100
METRIC RATING
133rd/ 347
METRIC RANK
$38,766
PER CAPITA INCOME
0.4/ 100
METRIC RATING
269th/ 347
METRIC RANK
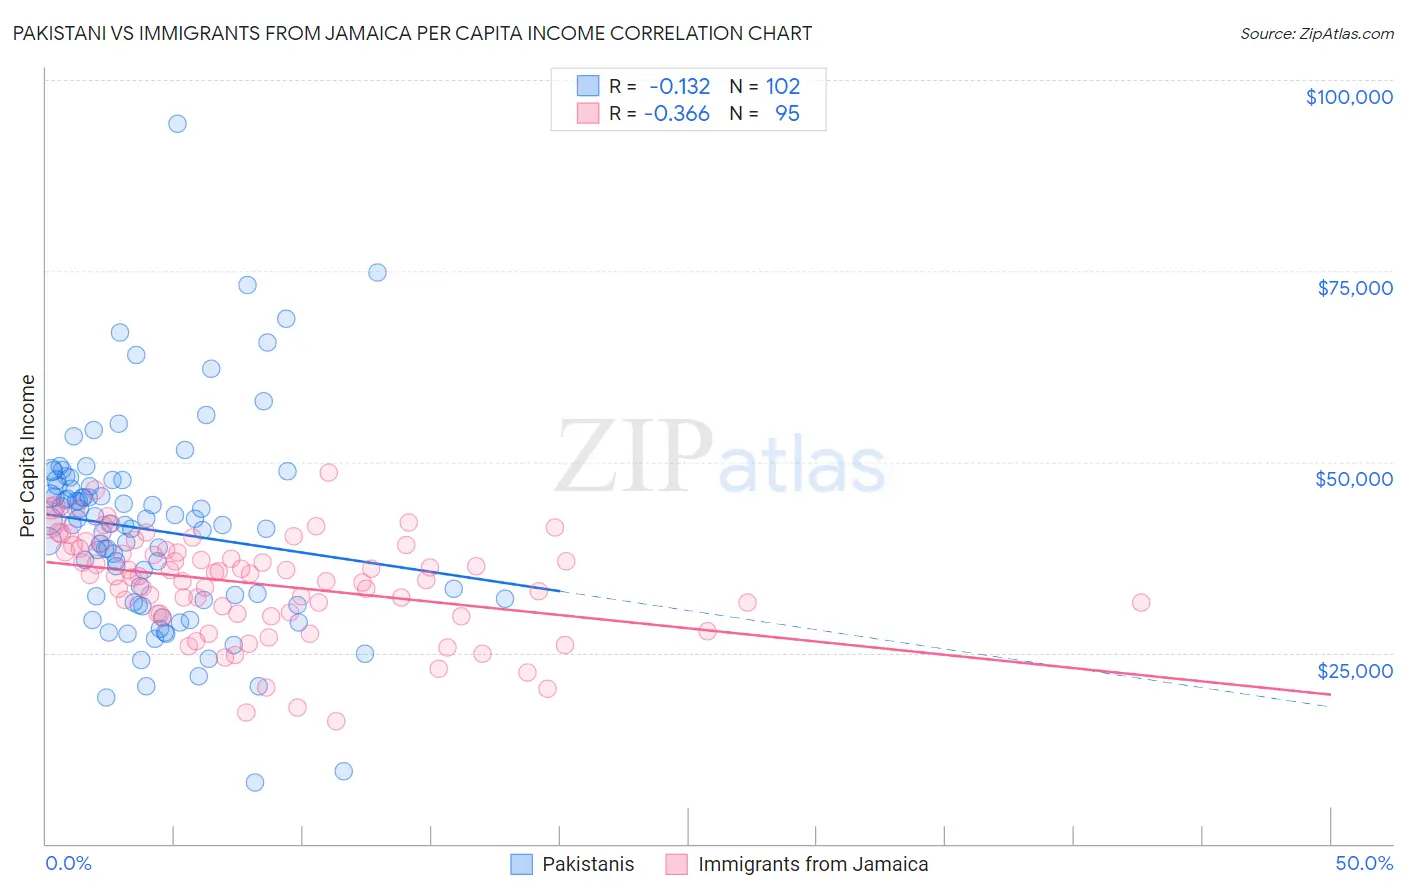
Pakistani vs Immigrants from Jamaica Per Capita Income Correlation Chart
The statistical analysis conducted on geographies consisting of 335,371,609 people shows a poor negative correlation between the proportion of Pakistanis and per capita income in the United States with a correlation coefficient (R) of -0.132 and weighted average of $45,587. Similarly, the statistical analysis conducted on geographies consisting of 301,814,943 people shows a mild negative correlation between the proportion of Immigrants from Jamaica and per capita income in the United States with a correlation coefficient (R) of -0.366 and weighted average of $38,766, a difference of 17.6%.
Per Capita Income Correlation Summary
| Measurement | Pakistani | Immigrants from Jamaica |
| Minimum | $8,026 | $16,033 |
| Maximum | $94,275 | $48,680 |
| Range | $86,249 | $32,647 |
| Mean | $41,080 | $34,027 |
| Median | $41,744 | $35,066 |
| Interquartile 25% (IQ1) | $31,965 | $30,104 |
| Interquartile 75% (IQ3) | $46,855 | $38,633 |
| Interquartile Range (IQR) | $14,890 | $8,529 |
| Standard Deviation (Sample) | $13,251 | $6,626 |
| Standard Deviation (Population) | $13,186 | $6,591 |
Similar Demographics by Per Capita Income
Demographics Similar to Pakistanis by Per Capita Income
In terms of per capita income, the demographic groups most similar to Pakistanis are Slovene ($45,581, a difference of 0.010%), Jordanian ($45,605, a difference of 0.040%), Immigrants from North Macedonia ($45,622, a difference of 0.080%), Arab ($45,662, a difference of 0.16%), and Luxembourger ($45,663, a difference of 0.17%).
| Demographics | Rating | Rank | Per Capita Income |
| Palestinians | 91.6 /100 | #126 | Exceptional $45,790 |
| Immigrants | Germany | 91.3 /100 | #127 | Exceptional $45,751 |
| Swedes | 91.3 /100 | #128 | Exceptional $45,750 |
| Luxembourgers | 90.4 /100 | #129 | Exceptional $45,663 |
| Arabs | 90.4 /100 | #130 | Exceptional $45,662 |
| Immigrants | North Macedonia | 90.0 /100 | #131 | Exceptional $45,622 |
| Jordanians | 89.9 /100 | #132 | Excellent $45,605 |
| Pakistanis | 89.7 /100 | #133 | Excellent $45,587 |
| Slovenes | 89.6 /100 | #134 | Excellent $45,581 |
| Hungarians | 87.9 /100 | #135 | Excellent $45,426 |
| Immigrants | Oceania | 85.2 /100 | #136 | Excellent $45,220 |
| Immigrants | Syria | 85.2 /100 | #137 | Excellent $45,218 |
| Assyrians/Chaldeans/Syriacs | 84.8 /100 | #138 | Excellent $45,195 |
| Basques | 83.2 /100 | #139 | Excellent $45,086 |
| Immigrants | Jordan | 82.9 /100 | #140 | Excellent $45,066 |
Demographics Similar to Immigrants from Jamaica by Per Capita Income
In terms of per capita income, the demographic groups most similar to Immigrants from Jamaica are Liberian ($38,780, a difference of 0.040%), Immigrants from Zaire ($38,848, a difference of 0.21%), Salvadoran ($38,858, a difference of 0.24%), Immigrants from Belize ($38,614, a difference of 0.39%), and Central American ($38,560, a difference of 0.53%).
| Demographics | Rating | Rank | Per Capita Income |
| Iroquois | 0.6 /100 | #262 | Tragic $39,104 |
| Belizeans | 0.6 /100 | #263 | Tragic $39,097 |
| Americans | 0.6 /100 | #264 | Tragic $39,039 |
| Spanish Americans | 0.5 /100 | #265 | Tragic $39,012 |
| Salvadorans | 0.5 /100 | #266 | Tragic $38,858 |
| Immigrants | Zaire | 0.4 /100 | #267 | Tragic $38,848 |
| Liberians | 0.4 /100 | #268 | Tragic $38,780 |
| Immigrants | Jamaica | 0.4 /100 | #269 | Tragic $38,766 |
| Immigrants | Belize | 0.3 /100 | #270 | Tragic $38,614 |
| Central Americans | 0.3 /100 | #271 | Tragic $38,560 |
| Immigrants | Cabo Verde | 0.3 /100 | #272 | Tragic $38,540 |
| Nepalese | 0.3 /100 | #273 | Tragic $38,442 |
| Immigrants | El Salvador | 0.3 /100 | #274 | Tragic $38,394 |
| Immigrants | Liberia | 0.2 /100 | #275 | Tragic $38,165 |
| Hmong | 0.2 /100 | #276 | Tragic $38,120 |