Pakistani vs Immigrants from Costa Rica Wage/Income Gap
COMPARE
Pakistani
Immigrants from Costa Rica
Wage/Income Gap
Wage/Income Gap Comparison
Pakistanis
Immigrants from Costa Rica
26.1%
WAGE/INCOME GAP
33.7/ 100
METRIC RATING
185th/ 347
METRIC RANK
24.7%
WAGE/INCOME GAP
92.4/ 100
METRIC RATING
132nd/ 347
METRIC RANK
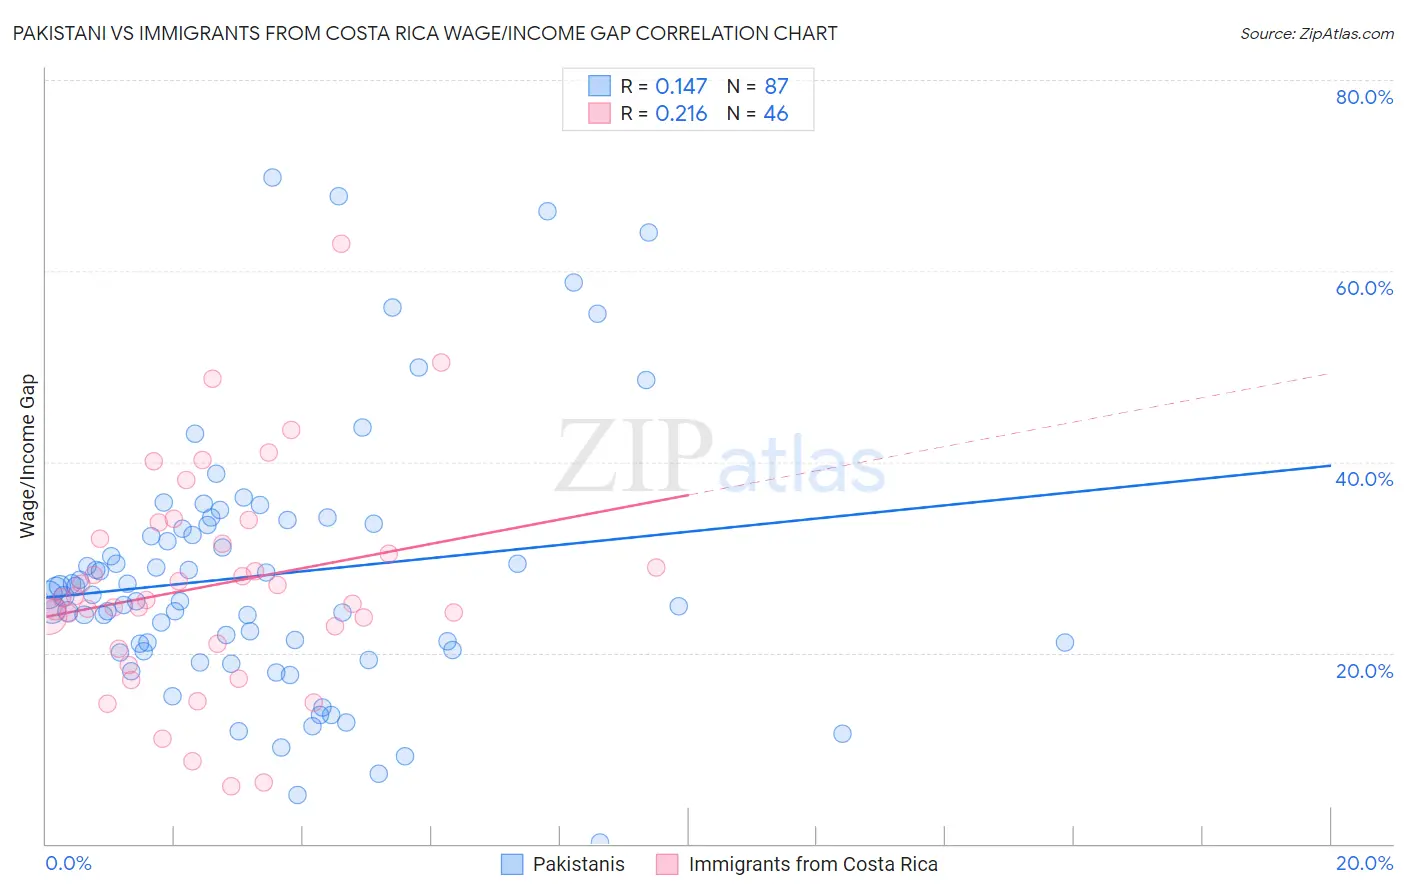
Pakistani vs Immigrants from Costa Rica Wage/Income Gap Correlation Chart
The statistical analysis conducted on geographies consisting of 335,237,953 people shows a poor positive correlation between the proportion of Pakistanis and wage/income gap percentage in the United States with a correlation coefficient (R) of 0.147 and weighted average of 26.1%. Similarly, the statistical analysis conducted on geographies consisting of 204,249,017 people shows a weak positive correlation between the proportion of Immigrants from Costa Rica and wage/income gap percentage in the United States with a correlation coefficient (R) of 0.216 and weighted average of 24.7%, a difference of 5.4%.
Wage/Income Gap Correlation Summary
| Measurement | Pakistani | Immigrants from Costa Rica |
| Minimum | 0.10% | 6.0% |
| Maximum | 69.7% | 62.8% |
| Range | 69.6% | 56.8% |
| Mean | 28.1% | 27.1% |
| Median | 26.1% | 25.7% |
| Interquartile 25% (IQ1) | 20.3% | 20.9% |
| Interquartile 75% (IQ3) | 33.4% | 31.9% |
| Interquartile Range (IQR) | 13.1% | 11.0% |
| Standard Deviation (Sample) | 13.6% | 11.3% |
| Standard Deviation (Population) | 13.6% | 11.2% |
Similar Demographics by Wage/Income Gap
Demographics Similar to Pakistanis by Wage/Income Gap
In terms of wage/income gap, the demographic groups most similar to Pakistanis are Mexican (26.0%, a difference of 0.050%), Immigrants from Indonesia (26.1%, a difference of 0.080%), Immigrants from Kazakhstan (26.0%, a difference of 0.11%), Immigrants from Serbia (26.0%, a difference of 0.12%), and Immigrants from Bolivia (26.0%, a difference of 0.19%).
| Demographics | Rating | Rank | Wage/Income Gap |
| Chinese | 42.0 /100 | #178 | Average 25.9% |
| Samoans | 38.6 /100 | #179 | Fair 26.0% |
| Guamanians/Chamorros | 38.0 /100 | #180 | Fair 26.0% |
| Immigrants | Bolivia | 36.4 /100 | #181 | Fair 26.0% |
| Immigrants | Serbia | 35.4 /100 | #182 | Fair 26.0% |
| Immigrants | Kazakhstan | 35.2 /100 | #183 | Fair 26.0% |
| Mexicans | 34.4 /100 | #184 | Fair 26.0% |
| Pakistanis | 33.7 /100 | #185 | Fair 26.1% |
| Immigrants | Indonesia | 32.5 /100 | #186 | Fair 26.1% |
| Palestinians | 29.9 /100 | #187 | Fair 26.1% |
| Immigrants | Egypt | 29.9 /100 | #188 | Fair 26.1% |
| Immigrants | Moldova | 26.6 /100 | #189 | Fair 26.2% |
| Immigrants | Croatia | 24.8 /100 | #190 | Fair 26.2% |
| Immigrants | Venezuela | 24.7 /100 | #191 | Fair 26.2% |
| Immigrants | Bulgaria | 22.5 /100 | #192 | Fair 26.3% |
Demographics Similar to Immigrants from Costa Rica by Wage/Income Gap
In terms of wage/income gap, the demographic groups most similar to Immigrants from Costa Rica are Colombian (24.7%, a difference of 0.0%), Mexican American Indian (24.7%, a difference of 0.040%), South American Indian (24.7%, a difference of 0.10%), Immigrants from Philippines (24.7%, a difference of 0.15%), and Alsatian (24.7%, a difference of 0.22%).
| Demographics | Rating | Rank | Wage/Income Gap |
| Spanish Americans | 93.8 /100 | #125 | Exceptional 24.6% |
| Immigrants | Uruguay | 93.8 /100 | #126 | Exceptional 24.6% |
| German Russians | 93.7 /100 | #127 | Exceptional 24.6% |
| Immigrants | Central America | 93.5 /100 | #128 | Exceptional 24.6% |
| Yup'ik | 93.3 /100 | #129 | Exceptional 24.7% |
| Alsatians | 93.2 /100 | #130 | Exceptional 24.7% |
| Immigrants | Philippines | 93.0 /100 | #131 | Exceptional 24.7% |
| Immigrants | Costa Rica | 92.4 /100 | #132 | Exceptional 24.7% |
| Colombians | 92.4 /100 | #133 | Exceptional 24.7% |
| Mexican American Indians | 92.2 /100 | #134 | Exceptional 24.7% |
| South American Indians | 92.0 /100 | #135 | Exceptional 24.7% |
| Armenians | 91.3 /100 | #136 | Exceptional 24.8% |
| Immigrants | South Eastern Asia | 90.9 /100 | #137 | Exceptional 24.8% |
| Immigrants | Bosnia and Herzegovina | 90.1 /100 | #138 | Exceptional 24.8% |
| Hispanics or Latinos | 89.5 /100 | #139 | Excellent 24.9% |