Pakistani vs Immigrants from Costa Rica Median Female Earnings
COMPARE
Pakistani
Immigrants from Costa Rica
Median Female Earnings
Median Female Earnings Comparison
Pakistanis
Immigrants from Costa Rica
$40,596
MEDIAN FEMALE EARNINGS
86.6/ 100
METRIC RATING
137th/ 347
METRIC RANK
$39,186
MEDIAN FEMALE EARNINGS
25.6/ 100
METRIC RATING
196th/ 347
METRIC RANK
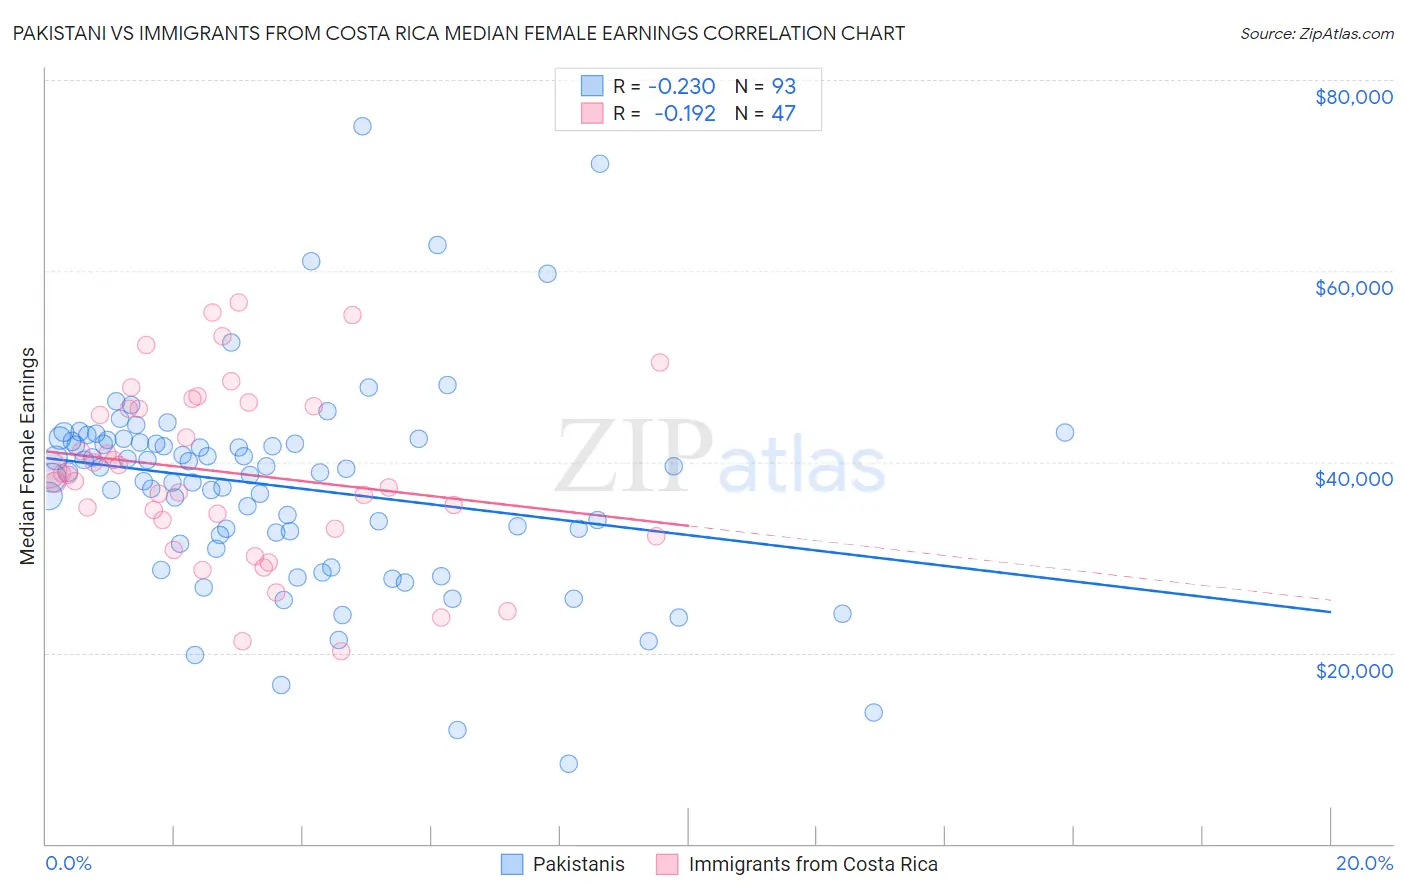
Pakistani vs Immigrants from Costa Rica Median Female Earnings Correlation Chart
The statistical analysis conducted on geographies consisting of 335,277,808 people shows a weak negative correlation between the proportion of Pakistanis and median female earnings in the United States with a correlation coefficient (R) of -0.230 and weighted average of $40,596. Similarly, the statistical analysis conducted on geographies consisting of 204,263,663 people shows a poor negative correlation between the proportion of Immigrants from Costa Rica and median female earnings in the United States with a correlation coefficient (R) of -0.192 and weighted average of $39,186, a difference of 3.6%.
Median Female Earnings Correlation Summary
| Measurement | Pakistani | Immigrants from Costa Rica |
| Minimum | $8,380 | $20,158 |
| Maximum | $75,132 | $56,684 |
| Range | $66,752 | $36,526 |
| Mean | $37,425 | $38,901 |
| Median | $38,904 | $38,633 |
| Interquartile 25% (IQ1) | $31,921 | $33,041 |
| Interquartile 75% (IQ3) | $42,191 | $45,796 |
| Interquartile Range (IQR) | $10,270 | $12,755 |
| Standard Deviation (Sample) | $10,860 | $9,096 |
| Standard Deviation (Population) | $10,802 | $8,998 |
Similar Demographics by Median Female Earnings
Demographics Similar to Pakistanis by Median Female Earnings
In terms of median female earnings, the demographic groups most similar to Pakistanis are Taiwanese ($40,576, a difference of 0.050%), Immigrants from South Eastern Asia ($40,558, a difference of 0.090%), Immigrants from Eastern Africa ($40,644, a difference of 0.12%), Serbian ($40,539, a difference of 0.14%), and Immigrants from Syria ($40,499, a difference of 0.24%).
| Demographics | Rating | Rank | Median Female Earnings |
| Immigrants | Guyana | 90.3 /100 | #130 | Exceptional $40,773 |
| Chileans | 90.0 /100 | #131 | Exceptional $40,757 |
| Immigrants | Uganda | 89.7 /100 | #132 | Excellent $40,739 |
| Syrians | 89.5 /100 | #133 | Excellent $40,727 |
| Arabs | 89.3 /100 | #134 | Excellent $40,718 |
| Immigrants | Nepal | 89.0 /100 | #135 | Excellent $40,704 |
| Immigrants | Eastern Africa | 87.7 /100 | #136 | Excellent $40,644 |
| Pakistanis | 86.6 /100 | #137 | Excellent $40,596 |
| Taiwanese | 86.1 /100 | #138 | Excellent $40,576 |
| Immigrants | South Eastern Asia | 85.7 /100 | #139 | Excellent $40,558 |
| Serbians | 85.2 /100 | #140 | Excellent $40,539 |
| Immigrants | Syria | 84.1 /100 | #141 | Excellent $40,499 |
| Sri Lankans | 84.0 /100 | #142 | Excellent $40,496 |
| Northern Europeans | 83.9 /100 | #143 | Excellent $40,491 |
| Immigrants | North Macedonia | 83.8 /100 | #144 | Excellent $40,488 |
Demographics Similar to Immigrants from Costa Rica by Median Female Earnings
In terms of median female earnings, the demographic groups most similar to Immigrants from Costa Rica are Assyrian/Chaldean/Syriac ($39,159, a difference of 0.070%), Uruguayan ($39,228, a difference of 0.11%), Ecuadorian ($39,117, a difference of 0.18%), Icelander ($39,109, a difference of 0.20%), and Irish ($39,291, a difference of 0.27%).
| Demographics | Rating | Rank | Median Female Earnings |
| Senegalese | 34.2 /100 | #189 | Fair $39,384 |
| Puget Sound Salish | 33.9 /100 | #190 | Fair $39,376 |
| Immigrants | Western Africa | 32.7 /100 | #191 | Fair $39,351 |
| Immigrants | Immigrants | 31.7 /100 | #192 | Fair $39,328 |
| Immigrants | Nigeria | 30.2 /100 | #193 | Fair $39,294 |
| Irish | 30.0 /100 | #194 | Fair $39,291 |
| Uruguayans | 27.3 /100 | #195 | Fair $39,228 |
| Immigrants | Costa Rica | 25.6 /100 | #196 | Fair $39,186 |
| Assyrians/Chaldeans/Syriacs | 24.6 /100 | #197 | Fair $39,159 |
| Ecuadorians | 23.0 /100 | #198 | Fair $39,117 |
| Icelanders | 22.7 /100 | #199 | Fair $39,109 |
| Immigrants | Panama | 20.6 /100 | #200 | Fair $39,049 |
| Panamanians | 20.6 /100 | #201 | Fair $39,049 |
| Slovaks | 19.9 /100 | #202 | Poor $39,029 |
| Czechs | 18.7 /100 | #203 | Poor $38,992 |