Pakistani vs Ghanaian Median Earnings
COMPARE
Pakistani
Ghanaian
Median Earnings
Median Earnings Comparison
Pakistanis
Ghanaians
$48,254
MEDIAN EARNINGS
92.8/ 100
METRIC RATING
129th/ 347
METRIC RANK
$46,440
MEDIAN EARNINGS
50.3/ 100
METRIC RATING
173rd/ 347
METRIC RANK
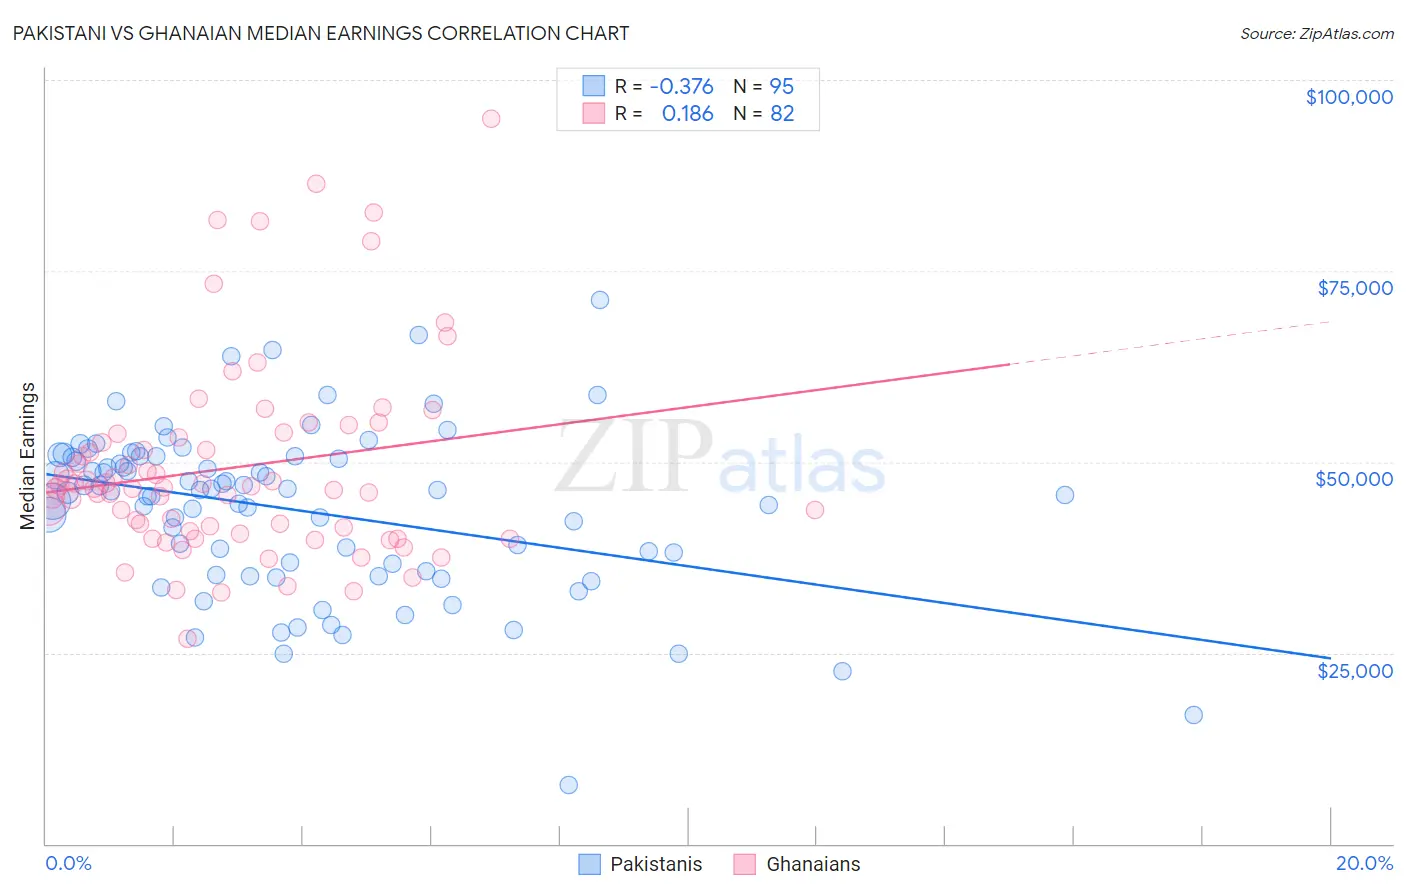
Pakistani vs Ghanaian Median Earnings Correlation Chart
The statistical analysis conducted on geographies consisting of 335,344,487 people shows a mild negative correlation between the proportion of Pakistanis and median earnings in the United States with a correlation coefficient (R) of -0.376 and weighted average of $48,254. Similarly, the statistical analysis conducted on geographies consisting of 190,721,240 people shows a poor positive correlation between the proportion of Ghanaians and median earnings in the United States with a correlation coefficient (R) of 0.186 and weighted average of $46,440, a difference of 3.9%.
Median Earnings Correlation Summary
| Measurement | Pakistani | Ghanaian |
| Minimum | $7,703 | $26,919 |
| Maximum | $71,250 | $94,961 |
| Range | $63,547 | $68,042 |
| Mean | $43,723 | $49,239 |
| Median | $46,169 | $46,600 |
| Interquartile 25% (IQ1) | $35,714 | $40,949 |
| Interquartile 75% (IQ3) | $50,670 | $53,241 |
| Interquartile Range (IQR) | $14,956 | $12,292 |
| Standard Deviation (Sample) | $10,826 | $12,902 |
| Standard Deviation (Population) | $10,769 | $12,823 |
Similar Demographics by Median Earnings
Demographics Similar to Pakistanis by Median Earnings
In terms of median earnings, the demographic groups most similar to Pakistanis are Immigrants from Philippines ($48,266, a difference of 0.020%), Zimbabwean ($48,229, a difference of 0.050%), Lebanese ($48,226, a difference of 0.060%), Sierra Leonean ($48,286, a difference of 0.070%), and Assyrian/Chaldean/Syriac ($48,304, a difference of 0.10%).
| Demographics | Rating | Rank | Median Earnings |
| Chileans | 94.8 /100 | #122 | Exceptional $48,504 |
| Immigrants | Syria | 93.9 /100 | #123 | Exceptional $48,375 |
| Brazilians | 93.7 /100 | #124 | Exceptional $48,356 |
| Immigrants | Fiji | 93.3 /100 | #125 | Exceptional $48,305 |
| Assyrians/Chaldeans/Syriacs | 93.3 /100 | #126 | Exceptional $48,304 |
| Sierra Leoneans | 93.1 /100 | #127 | Exceptional $48,286 |
| Immigrants | Philippines | 92.9 /100 | #128 | Exceptional $48,266 |
| Pakistanis | 92.8 /100 | #129 | Exceptional $48,254 |
| Zimbabweans | 92.6 /100 | #130 | Exceptional $48,229 |
| Lebanese | 92.5 /100 | #131 | Exceptional $48,226 |
| British | 92.2 /100 | #132 | Exceptional $48,189 |
| Immigrants | Uganda | 90.5 /100 | #133 | Exceptional $48,041 |
| Sri Lankans | 90.5 /100 | #134 | Exceptional $48,040 |
| Portuguese | 90.4 /100 | #135 | Exceptional $48,032 |
| Slovenes | 90.0 /100 | #136 | Excellent $47,995 |
Demographics Similar to Ghanaians by Median Earnings
In terms of median earnings, the demographic groups most similar to Ghanaians are Scandinavian ($46,433, a difference of 0.020%), Scottish ($46,463, a difference of 0.050%), Kenyan ($46,462, a difference of 0.050%), Immigrants ($46,478, a difference of 0.080%), and Basque ($46,399, a difference of 0.090%).
| Demographics | Rating | Rank | Median Earnings |
| Czechoslovakians | 57.8 /100 | #166 | Average $46,658 |
| Costa Ricans | 57.4 /100 | #167 | Average $46,645 |
| Immigrants | Africa | 54.6 /100 | #168 | Average $46,564 |
| Immigrants | South America | 54.0 /100 | #169 | Average $46,548 |
| Immigrants | Immigrants | 51.6 /100 | #170 | Average $46,478 |
| Scottish | 51.1 /100 | #171 | Average $46,463 |
| Kenyans | 51.0 /100 | #172 | Average $46,462 |
| Ghanaians | 50.3 /100 | #173 | Average $46,440 |
| Scandinavians | 50.0 /100 | #174 | Average $46,433 |
| Basques | 48.8 /100 | #175 | Average $46,399 |
| Danes | 48.6 /100 | #176 | Average $46,392 |
| Belgians | 48.0 /100 | #177 | Average $46,375 |
| Colombians | 47.1 /100 | #178 | Average $46,349 |
| English | 46.5 /100 | #179 | Average $46,334 |
| Puget Sound Salish | 46.5 /100 | #180 | Average $46,333 |