Immigrants from Jordan vs Ghanaian Median Earnings
COMPARE
Immigrants from Jordan
Ghanaian
Median Earnings
Median Earnings Comparison
Immigrants from Jordan
Ghanaians
$48,673
MEDIAN EARNINGS
95.9/ 100
METRIC RATING
118th/ 347
METRIC RANK
$46,440
MEDIAN EARNINGS
50.3/ 100
METRIC RATING
173rd/ 347
METRIC RANK
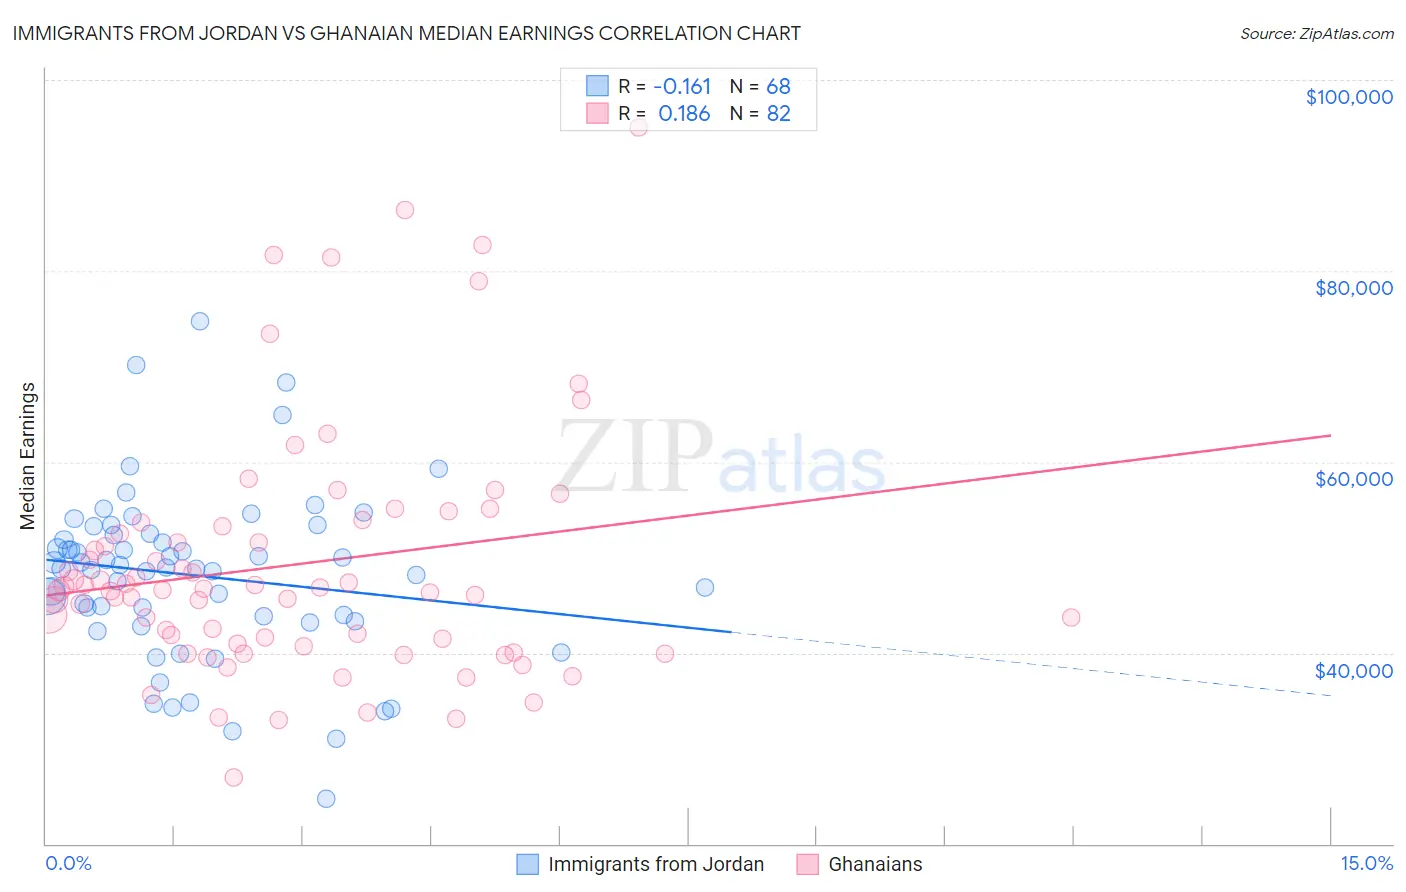
Immigrants from Jordan vs Ghanaian Median Earnings Correlation Chart
The statistical analysis conducted on geographies consisting of 181,245,350 people shows a poor negative correlation between the proportion of Immigrants from Jordan and median earnings in the United States with a correlation coefficient (R) of -0.161 and weighted average of $48,673. Similarly, the statistical analysis conducted on geographies consisting of 190,721,240 people shows a poor positive correlation between the proportion of Ghanaians and median earnings in the United States with a correlation coefficient (R) of 0.186 and weighted average of $46,440, a difference of 4.8%.
Median Earnings Correlation Summary
| Measurement | Immigrants from Jordan | Ghanaian |
| Minimum | $24,779 | $26,919 |
| Maximum | $74,707 | $94,961 |
| Range | $49,928 | $68,042 |
| Mean | $48,083 | $49,239 |
| Median | $48,848 | $46,600 |
| Interquartile 25% (IQ1) | $43,626 | $40,949 |
| Interquartile 75% (IQ3) | $52,401 | $53,241 |
| Interquartile Range (IQR) | $8,775 | $12,292 |
| Standard Deviation (Sample) | $8,922 | $12,902 |
| Standard Deviation (Population) | $8,857 | $12,823 |
Similar Demographics by Median Earnings
Demographics Similar to Immigrants from Jordan by Median Earnings
In terms of median earnings, the demographic groups most similar to Immigrants from Jordan are Serbian ($48,677, a difference of 0.010%), Polish ($48,659, a difference of 0.030%), Korean ($48,727, a difference of 0.11%), Carpatho Rusyn ($48,617, a difference of 0.11%), and Arab ($48,599, a difference of 0.15%).
| Demographics | Rating | Rank | Median Earnings |
| Immigrants | Zimbabwe | 97.0 /100 | #111 | Exceptional $48,913 |
| Northern Europeans | 96.9 /100 | #112 | Exceptional $48,887 |
| Immigrants | Kuwait | 96.8 /100 | #113 | Exceptional $48,861 |
| Moroccans | 96.7 /100 | #114 | Exceptional $48,838 |
| Chinese | 96.7 /100 | #115 | Exceptional $48,836 |
| Koreans | 96.2 /100 | #116 | Exceptional $48,727 |
| Serbians | 95.9 /100 | #117 | Exceptional $48,677 |
| Immigrants | Jordan | 95.9 /100 | #118 | Exceptional $48,673 |
| Poles | 95.8 /100 | #119 | Exceptional $48,659 |
| Carpatho Rusyns | 95.5 /100 | #120 | Exceptional $48,617 |
| Arabs | 95.4 /100 | #121 | Exceptional $48,599 |
| Chileans | 94.8 /100 | #122 | Exceptional $48,504 |
| Immigrants | Syria | 93.9 /100 | #123 | Exceptional $48,375 |
| Brazilians | 93.7 /100 | #124 | Exceptional $48,356 |
| Immigrants | Fiji | 93.3 /100 | #125 | Exceptional $48,305 |
Demographics Similar to Ghanaians by Median Earnings
In terms of median earnings, the demographic groups most similar to Ghanaians are Scandinavian ($46,433, a difference of 0.020%), Scottish ($46,463, a difference of 0.050%), Kenyan ($46,462, a difference of 0.050%), Immigrants ($46,478, a difference of 0.080%), and Basque ($46,399, a difference of 0.090%).
| Demographics | Rating | Rank | Median Earnings |
| Czechoslovakians | 57.8 /100 | #166 | Average $46,658 |
| Costa Ricans | 57.4 /100 | #167 | Average $46,645 |
| Immigrants | Africa | 54.6 /100 | #168 | Average $46,564 |
| Immigrants | South America | 54.0 /100 | #169 | Average $46,548 |
| Immigrants | Immigrants | 51.6 /100 | #170 | Average $46,478 |
| Scottish | 51.1 /100 | #171 | Average $46,463 |
| Kenyans | 51.0 /100 | #172 | Average $46,462 |
| Ghanaians | 50.3 /100 | #173 | Average $46,440 |
| Scandinavians | 50.0 /100 | #174 | Average $46,433 |
| Basques | 48.8 /100 | #175 | Average $46,399 |
| Danes | 48.6 /100 | #176 | Average $46,392 |
| Belgians | 48.0 /100 | #177 | Average $46,375 |
| Colombians | 47.1 /100 | #178 | Average $46,349 |
| English | 46.5 /100 | #179 | Average $46,334 |
| Puget Sound Salish | 46.5 /100 | #180 | Average $46,333 |