Osage vs Immigrants from Eastern Africa Per Capita Income
COMPARE
Osage
Immigrants from Eastern Africa
Per Capita Income
Per Capita Income Comparison
Osage
Immigrants from Eastern Africa
$39,568
PER CAPITA INCOME
1.0/ 100
METRIC RATING
253rd/ 347
METRIC RANK
$43,838
PER CAPITA INCOME
54.9/ 100
METRIC RATING
171st/ 347
METRIC RANK
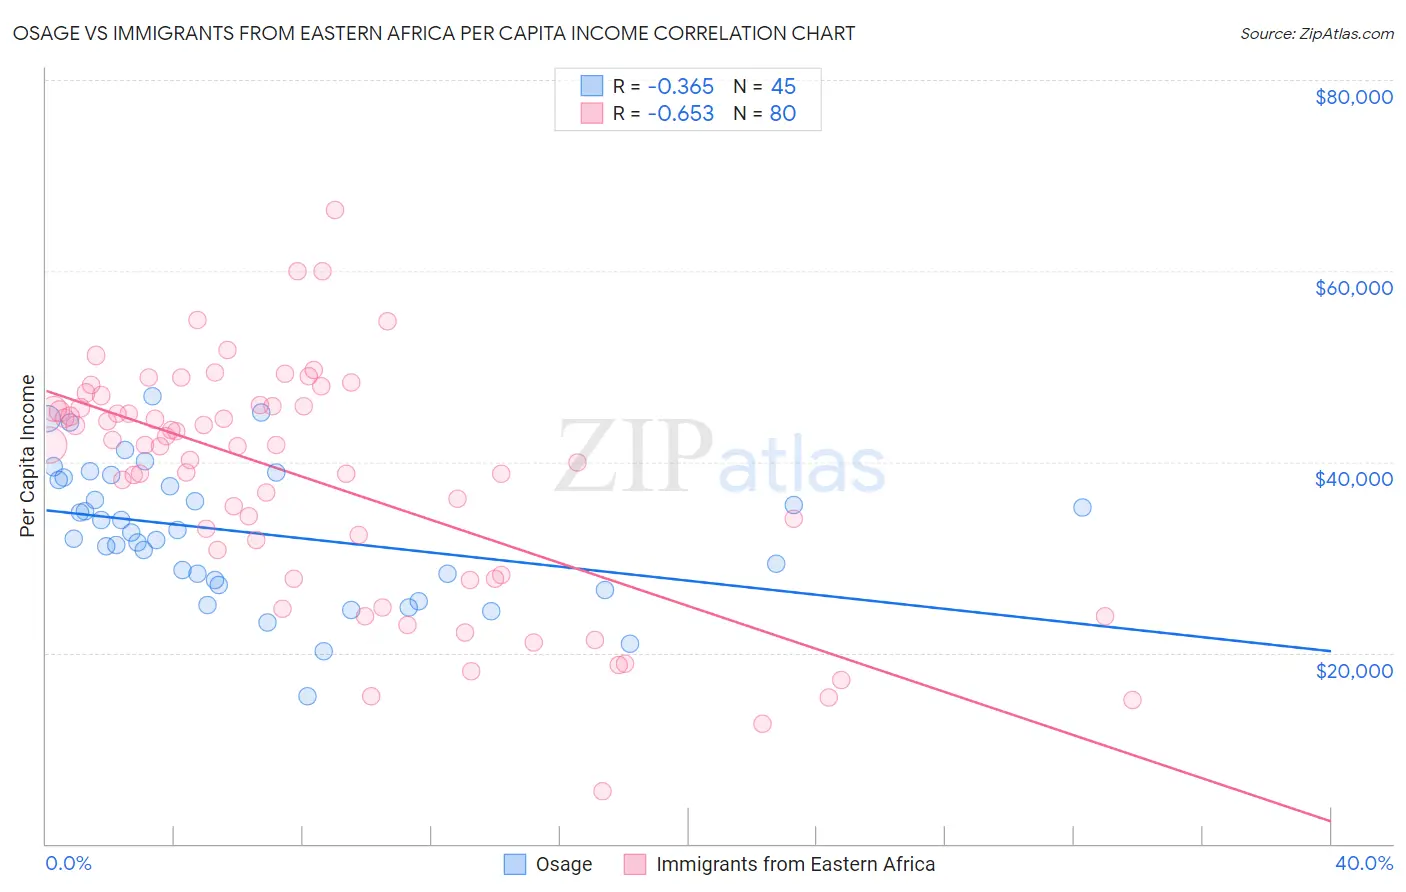
Osage vs Immigrants from Eastern Africa Per Capita Income Correlation Chart
The statistical analysis conducted on geographies consisting of 91,808,929 people shows a mild negative correlation between the proportion of Osage and per capita income in the United States with a correlation coefficient (R) of -0.365 and weighted average of $39,568. Similarly, the statistical analysis conducted on geographies consisting of 355,180,716 people shows a significant negative correlation between the proportion of Immigrants from Eastern Africa and per capita income in the United States with a correlation coefficient (R) of -0.653 and weighted average of $43,838, a difference of 10.8%.
Per Capita Income Correlation Summary
| Measurement | Osage | Immigrants from Eastern Africa |
| Minimum | $15,396 | $5,516 |
| Maximum | $46,906 | $66,352 |
| Range | $31,510 | $60,836 |
| Mean | $32,578 | $37,946 |
| Median | $32,608 | $41,723 |
| Interquartile 25% (IQ1) | $27,395 | $27,967 |
| Interquartile 75% (IQ3) | $38,257 | $45,811 |
| Interquartile Range (IQR) | $10,862 | $17,844 |
| Standard Deviation (Sample) | $7,093 | $12,344 |
| Standard Deviation (Population) | $7,014 | $12,266 |
Similar Demographics by Per Capita Income
Demographics Similar to Osage by Per Capita Income
In terms of per capita income, the demographic groups most similar to Osage are Alaska Native ($39,558, a difference of 0.020%), Immigrants from the Azores ($39,608, a difference of 0.10%), Immigrants from Middle Africa ($39,529, a difference of 0.10%), Hawaiian ($39,403, a difference of 0.42%), and Nicaraguan ($39,372, a difference of 0.50%).
| Demographics | Rating | Rank | Per Capita Income |
| Cree | 1.7 /100 | #246 | Tragic $40,056 |
| Immigrants | Somalia | 1.6 /100 | #247 | Tragic $39,974 |
| Cape Verdeans | 1.5 /100 | #248 | Tragic $39,935 |
| Japanese | 1.4 /100 | #249 | Tragic $39,870 |
| Immigrants | Burma/Myanmar | 1.3 /100 | #250 | Tragic $39,827 |
| Samoans | 1.3 /100 | #251 | Tragic $39,826 |
| Immigrants | Azores | 1.0 /100 | #252 | Tragic $39,608 |
| Osage | 1.0 /100 | #253 | Tragic $39,568 |
| Alaska Natives | 1.0 /100 | #254 | Tragic $39,558 |
| Immigrants | Middle Africa | 1.0 /100 | #255 | Tragic $39,529 |
| Hawaiians | 0.8 /100 | #256 | Tragic $39,403 |
| Nicaraguans | 0.8 /100 | #257 | Tragic $39,372 |
| Jamaicans | 0.7 /100 | #258 | Tragic $39,231 |
| Malaysians | 0.7 /100 | #259 | Tragic $39,194 |
| Alaskan Athabascans | 0.6 /100 | #260 | Tragic $39,163 |
Demographics Similar to Immigrants from Eastern Africa by Per Capita Income
In terms of per capita income, the demographic groups most similar to Immigrants from Eastern Africa are Scandinavian ($43,848, a difference of 0.020%), Immigrants from Peru ($43,852, a difference of 0.030%), Czechoslovakian ($43,806, a difference of 0.070%), Belgian ($43,951, a difference of 0.26%), and English ($43,982, a difference of 0.33%).
| Demographics | Rating | Rank | Per Capita Income |
| Sri Lankans | 59.8 /100 | #164 | Average $44,014 |
| Immigrants | Philippines | 59.4 /100 | #165 | Average $44,000 |
| Immigrants | Uruguay | 59.3 /100 | #166 | Average $43,997 |
| English | 58.9 /100 | #167 | Average $43,982 |
| Belgians | 58.1 /100 | #168 | Average $43,951 |
| Immigrants | Peru | 55.3 /100 | #169 | Average $43,852 |
| Scandinavians | 55.2 /100 | #170 | Average $43,848 |
| Immigrants | Eastern Africa | 54.9 /100 | #171 | Average $43,838 |
| Czechoslovakians | 54.1 /100 | #172 | Average $43,806 |
| French | 50.7 /100 | #173 | Average $43,685 |
| Colombians | 50.0 /100 | #174 | Average $43,661 |
| Celtics | 48.9 /100 | #175 | Average $43,621 |
| Immigrants | South Eastern Asia | 46.6 /100 | #176 | Average $43,539 |
| Tlingit-Haida | 45.9 /100 | #177 | Average $43,516 |
| Immigrants | Costa Rica | 44.5 /100 | #178 | Average $43,464 |