Osage vs Belizean Householder Income Ages 25 - 44 years
COMPARE
Osage
Belizean
Householder Income Ages 25 - 44 years
Householder Income Ages 25 - 44 years Comparison
Osage
Belizeans
$84,461
HOUSEHOLDER INCOME AGES 25 - 44 YEARS
0.4/ 100
METRIC RATING
264th/ 347
METRIC RANK
$84,534
HOUSEHOLDER INCOME AGES 25 - 44 YEARS
0.4/ 100
METRIC RATING
263rd/ 347
METRIC RANK
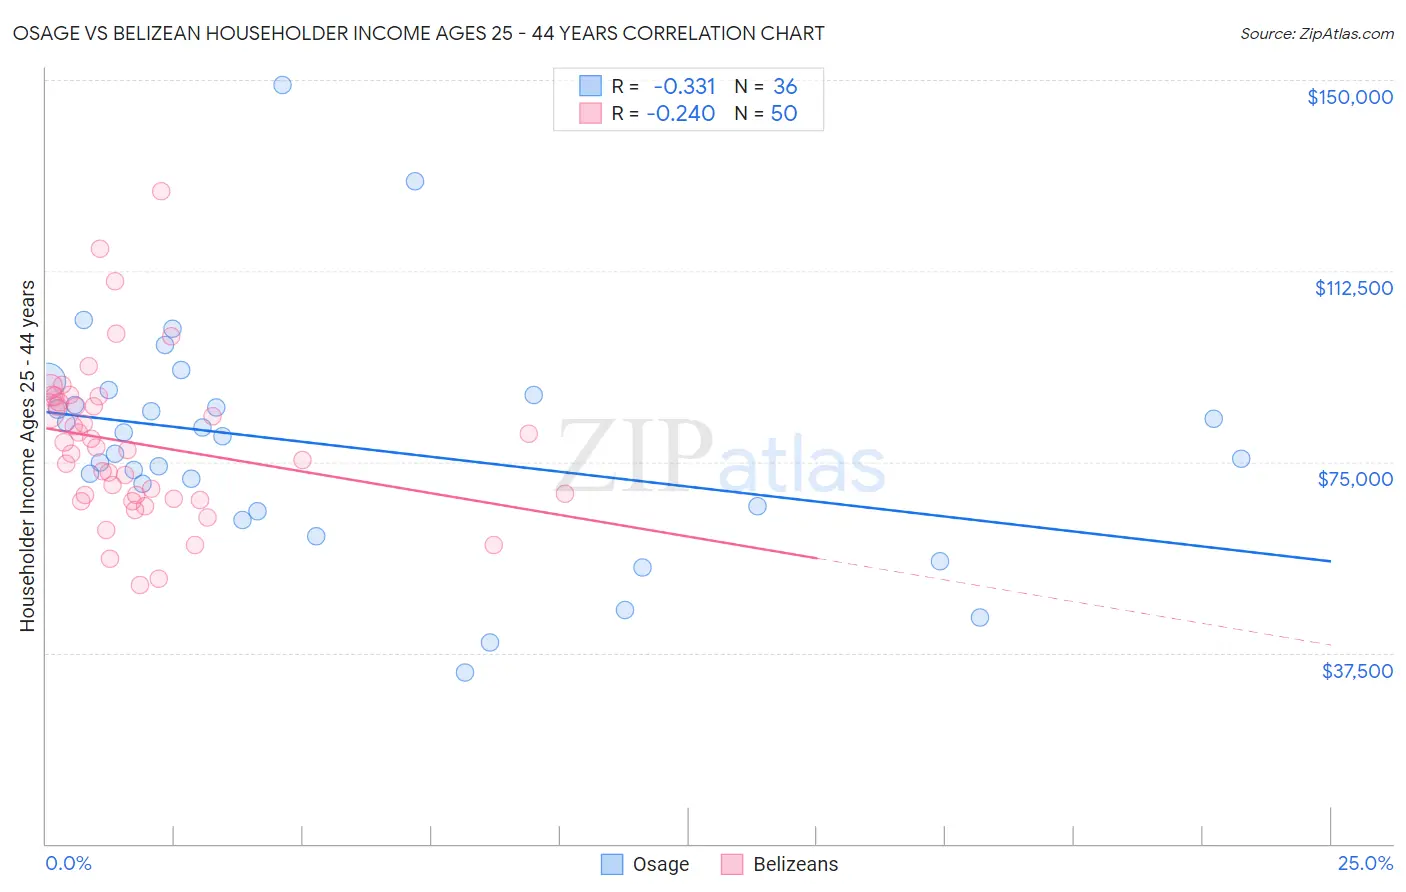
Osage vs Belizean Householder Income Ages 25 - 44 years Correlation Chart
The statistical analysis conducted on geographies consisting of 91,715,382 people shows a mild negative correlation between the proportion of Osage and household income with householder between the ages 25 and 44 in the United States with a correlation coefficient (R) of -0.331 and weighted average of $84,461. Similarly, the statistical analysis conducted on geographies consisting of 144,109,917 people shows a weak negative correlation between the proportion of Belizeans and household income with householder between the ages 25 and 44 in the United States with a correlation coefficient (R) of -0.240 and weighted average of $84,534, a difference of 0.090%.
Householder Income Ages 25 - 44 years Correlation Summary
| Measurement | Osage | Belizean |
| Minimum | $33,750 | $50,928 |
| Maximum | $148,966 | $128,125 |
| Range | $115,216 | $77,197 |
| Mean | $78,092 | $78,550 |
| Median | $78,270 | $77,650 |
| Interquartile 25% (IQ1) | $65,799 | $67,791 |
| Interquartile 75% (IQ3) | $87,100 | $86,760 |
| Interquartile Range (IQR) | $21,301 | $18,970 |
| Standard Deviation (Sample) | $22,591 | $15,455 |
| Standard Deviation (Population) | $22,275 | $15,299 |
Demographics Similar to Osage and Belizeans by Householder Income Ages 25 - 44 years
In terms of householder income ages 25 - 44 years, the demographic groups most similar to Osage are Sudanese ($84,401, a difference of 0.070%), Cree ($84,574, a difference of 0.13%), Inupiat ($84,619, a difference of 0.19%), Immigrants from Cabo Verde ($84,304, a difference of 0.19%), and Hmong ($84,258, a difference of 0.24%). Similarly, the demographic groups most similar to Belizeans are Cree ($84,574, a difference of 0.050%), Inupiat ($84,619, a difference of 0.10%), Sudanese ($84,401, a difference of 0.16%), Immigrants from Cabo Verde ($84,304, a difference of 0.27%), and American ($84,791, a difference of 0.30%).
| Demographics | Rating | Rank | Householder Income Ages 25 - 44 years |
| British West Indians | 0.7 /100 | #253 | Tragic $85,565 |
| Immigrants | Laos | 0.7 /100 | #254 | Tragic $85,553 |
| German Russians | 0.6 /100 | #255 | Tragic $85,220 |
| Central Americans | 0.5 /100 | #256 | Tragic $85,144 |
| Mexican American Indians | 0.5 /100 | #257 | Tragic $85,066 |
| Immigrants | Nicaragua | 0.5 /100 | #258 | Tragic $84,914 |
| Immigrants | Senegal | 0.5 /100 | #259 | Tragic $84,848 |
| Americans | 0.4 /100 | #260 | Tragic $84,791 |
| Inupiat | 0.4 /100 | #261 | Tragic $84,619 |
| Cree | 0.4 /100 | #262 | Tragic $84,574 |
| Belizeans | 0.4 /100 | #263 | Tragic $84,534 |
| Osage | 0.4 /100 | #264 | Tragic $84,461 |
| Sudanese | 0.4 /100 | #265 | Tragic $84,401 |
| Immigrants | Cabo Verde | 0.3 /100 | #266 | Tragic $84,304 |
| Hmong | 0.3 /100 | #267 | Tragic $84,258 |
| Sub-Saharan Africans | 0.3 /100 | #268 | Tragic $84,235 |
| Spanish American Indians | 0.3 /100 | #269 | Tragic $84,085 |
| Jamaicans | 0.3 /100 | #270 | Tragic $83,933 |
| Somalis | 0.2 /100 | #271 | Tragic $83,752 |
| Spanish Americans | 0.2 /100 | #272 | Tragic $83,722 |
| Iroquois | 0.2 /100 | #273 | Tragic $83,682 |