Dutch West Indian vs Belizean Householder Income Ages 25 - 44 years
COMPARE
Dutch West Indian
Belizean
Householder Income Ages 25 - 44 years
Householder Income Ages 25 - 44 years Comparison
Dutch West Indians
Belizeans
$77,260
HOUSEHOLDER INCOME AGES 25 - 44 YEARS
0.0/ 100
METRIC RATING
324th/ 347
METRIC RANK
$84,534
HOUSEHOLDER INCOME AGES 25 - 44 YEARS
0.4/ 100
METRIC RATING
263rd/ 347
METRIC RANK
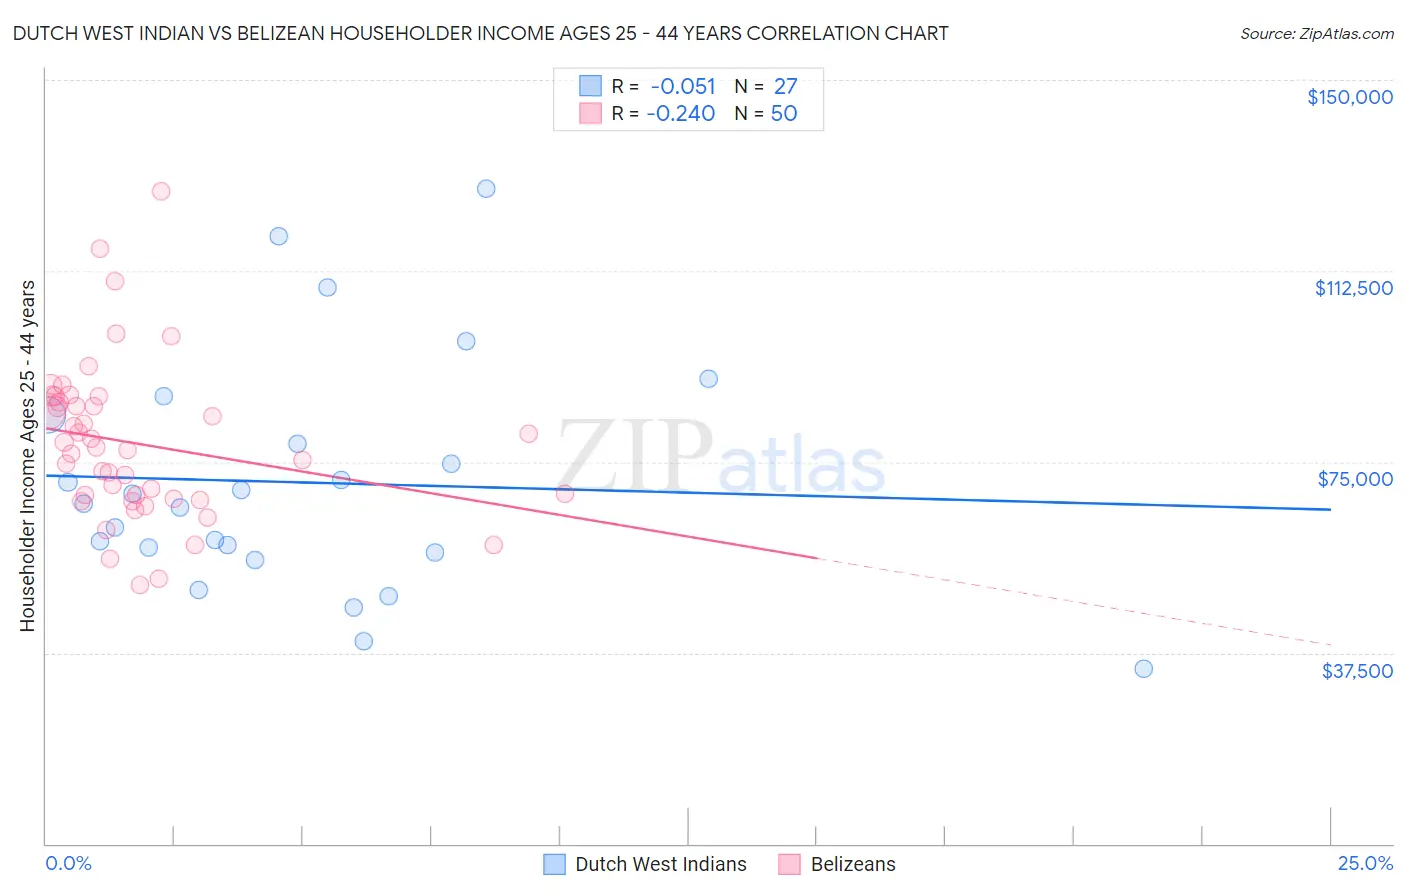
Dutch West Indian vs Belizean Householder Income Ages 25 - 44 years Correlation Chart
The statistical analysis conducted on geographies consisting of 85,685,681 people shows a slight negative correlation between the proportion of Dutch West Indians and household income with householder between the ages 25 and 44 in the United States with a correlation coefficient (R) of -0.051 and weighted average of $77,260. Similarly, the statistical analysis conducted on geographies consisting of 144,109,917 people shows a weak negative correlation between the proportion of Belizeans and household income with householder between the ages 25 and 44 in the United States with a correlation coefficient (R) of -0.240 and weighted average of $84,534, a difference of 9.4%.
Householder Income Ages 25 - 44 years Correlation Summary
| Measurement | Dutch West Indian | Belizean |
| Minimum | $34,250 | $50,928 |
| Maximum | $128,750 | $128,125 |
| Range | $94,500 | $77,197 |
| Mean | $70,946 | $78,550 |
| Median | $66,805 | $77,650 |
| Interquartile 25% (IQ1) | $57,188 | $67,791 |
| Interquartile 75% (IQ3) | $84,121 | $86,760 |
| Interquartile Range (IQR) | $26,933 | $18,970 |
| Standard Deviation (Sample) | $23,101 | $15,455 |
| Standard Deviation (Population) | $22,670 | $15,299 |
Similar Demographics by Householder Income Ages 25 - 44 years
Demographics Similar to Dutch West Indians by Householder Income Ages 25 - 44 years
In terms of householder income ages 25 - 44 years, the demographic groups most similar to Dutch West Indians are Immigrants from Honduras ($77,328, a difference of 0.090%), Sioux ($77,089, a difference of 0.22%), Houma ($77,044, a difference of 0.28%), Immigrants from Bahamas ($76,910, a difference of 0.46%), and Immigrants from Cuba ($76,701, a difference of 0.73%).
| Demographics | Rating | Rank | Householder Income Ages 25 - 44 years |
| U.S. Virgin Islanders | 0.0 /100 | #317 | Tragic $78,911 |
| Immigrants | Mexico | 0.0 /100 | #318 | Tragic $78,809 |
| Hondurans | 0.0 /100 | #319 | Tragic $78,540 |
| Choctaw | 0.0 /100 | #320 | Tragic $78,168 |
| Immigrants | Zaire | 0.0 /100 | #321 | Tragic $78,045 |
| Chickasaw | 0.0 /100 | #322 | Tragic $77,929 |
| Immigrants | Honduras | 0.0 /100 | #323 | Tragic $77,328 |
| Dutch West Indians | 0.0 /100 | #324 | Tragic $77,260 |
| Sioux | 0.0 /100 | #325 | Tragic $77,089 |
| Houma | 0.0 /100 | #326 | Tragic $77,044 |
| Immigrants | Bahamas | 0.0 /100 | #327 | Tragic $76,910 |
| Immigrants | Cuba | 0.0 /100 | #328 | Tragic $76,701 |
| Seminole | 0.0 /100 | #329 | Tragic $76,584 |
| Yakama | 0.0 /100 | #330 | Tragic $76,226 |
| Natives/Alaskans | 0.0 /100 | #331 | Tragic $75,647 |
Demographics Similar to Belizeans by Householder Income Ages 25 - 44 years
In terms of householder income ages 25 - 44 years, the demographic groups most similar to Belizeans are Cree ($84,574, a difference of 0.050%), Osage ($84,461, a difference of 0.090%), Inupiat ($84,619, a difference of 0.10%), Sudanese ($84,401, a difference of 0.16%), and Immigrants from Cabo Verde ($84,304, a difference of 0.27%).
| Demographics | Rating | Rank | Householder Income Ages 25 - 44 years |
| Central Americans | 0.5 /100 | #256 | Tragic $85,144 |
| Mexican American Indians | 0.5 /100 | #257 | Tragic $85,066 |
| Immigrants | Nicaragua | 0.5 /100 | #258 | Tragic $84,914 |
| Immigrants | Senegal | 0.5 /100 | #259 | Tragic $84,848 |
| Americans | 0.4 /100 | #260 | Tragic $84,791 |
| Inupiat | 0.4 /100 | #261 | Tragic $84,619 |
| Cree | 0.4 /100 | #262 | Tragic $84,574 |
| Belizeans | 0.4 /100 | #263 | Tragic $84,534 |
| Osage | 0.4 /100 | #264 | Tragic $84,461 |
| Sudanese | 0.4 /100 | #265 | Tragic $84,401 |
| Immigrants | Cabo Verde | 0.3 /100 | #266 | Tragic $84,304 |
| Hmong | 0.3 /100 | #267 | Tragic $84,258 |
| Sub-Saharan Africans | 0.3 /100 | #268 | Tragic $84,235 |
| Spanish American Indians | 0.3 /100 | #269 | Tragic $84,085 |
| Jamaicans | 0.3 /100 | #270 | Tragic $83,933 |