Northern European vs Haitian Median Family Income
COMPARE
Northern European
Haitian
Median Family Income
Median Family Income Comparison
Northern Europeans
Haitians
$110,635
MEDIAN FAMILY INCOME
98.3/ 100
METRIC RATING
90th/ 347
METRIC RANK
$85,218
MEDIAN FAMILY INCOME
0.0/ 100
METRIC RATING
309th/ 347
METRIC RANK
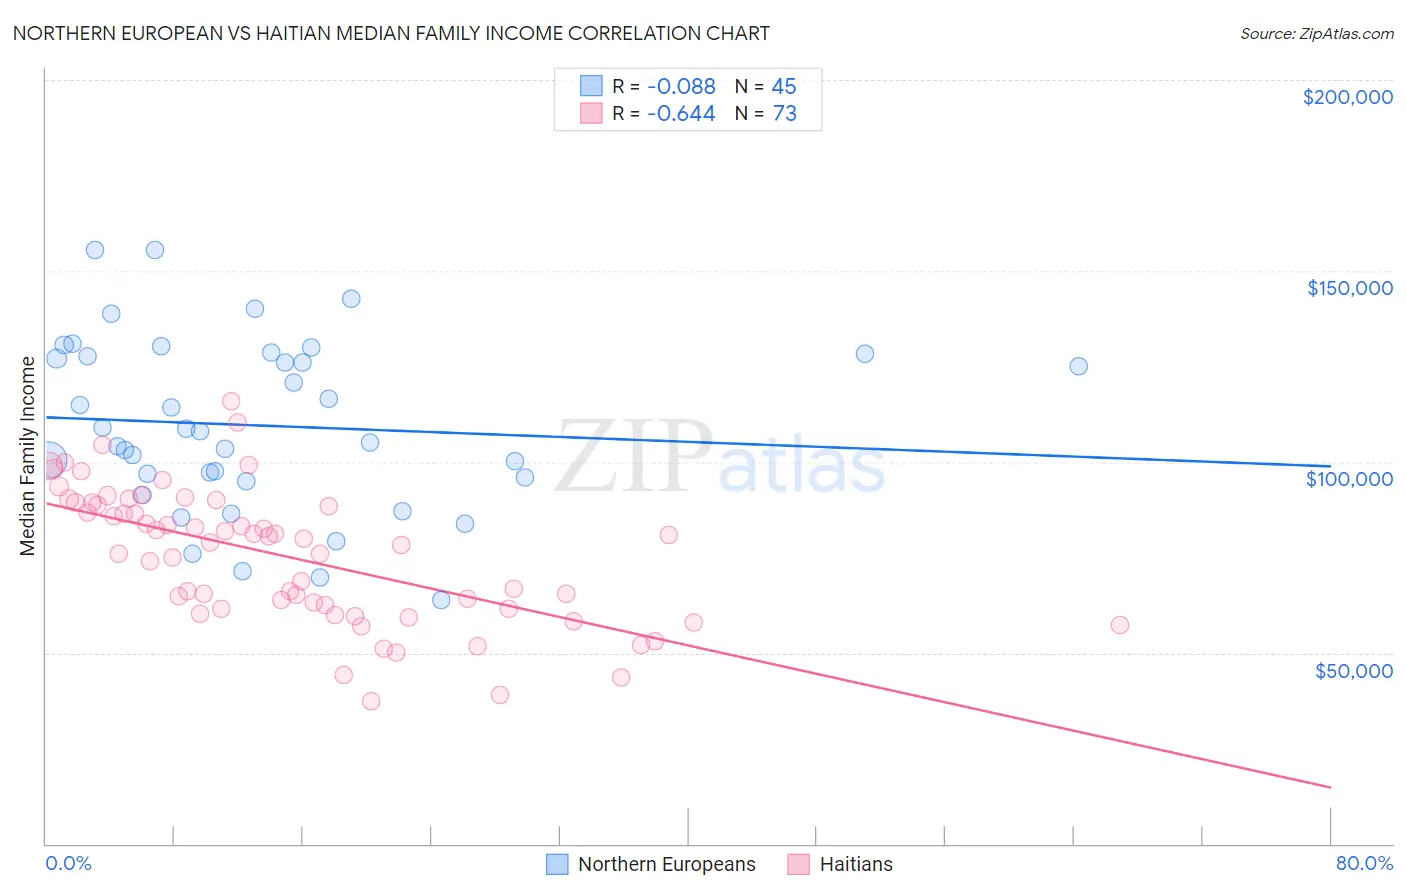
Northern European vs Haitian Median Family Income Correlation Chart
The statistical analysis conducted on geographies consisting of 405,831,688 people shows a slight negative correlation between the proportion of Northern Europeans and median family income in the United States with a correlation coefficient (R) of -0.088 and weighted average of $110,635. Similarly, the statistical analysis conducted on geographies consisting of 287,578,429 people shows a significant negative correlation between the proportion of Haitians and median family income in the United States with a correlation coefficient (R) of -0.644 and weighted average of $85,218, a difference of 29.8%.
Median Family Income Correlation Summary
| Measurement | Northern European | Haitian |
| Minimum | $63,831 | $37,244 |
| Maximum | $155,510 | $115,792 |
| Range | $91,679 | $78,548 |
| Mean | $109,529 | $75,276 |
| Median | $108,010 | $79,021 |
| Interquartile 25% (IQ1) | $95,374 | $61,587 |
| Interquartile 75% (IQ3) | $127,951 | $88,995 |
| Interquartile Range (IQR) | $32,577 | $27,408 |
| Standard Deviation (Sample) | $22,485 | $17,405 |
| Standard Deviation (Population) | $22,234 | $17,285 |
Similar Demographics by Median Family Income
Demographics Similar to Northern Europeans by Median Family Income
In terms of median family income, the demographic groups most similar to Northern Europeans are Immigrants from Southern Europe ($110,614, a difference of 0.020%), Immigrants from Argentina ($110,873, a difference of 0.21%), Immigrants from Lebanon ($110,159, a difference of 0.43%), Immigrants from Kazakhstan ($110,137, a difference of 0.45%), and Korean ($110,103, a difference of 0.48%).
| Demographics | Rating | Rank | Median Family Income |
| Immigrants | Egypt | 99.0 /100 | #83 | Exceptional $111,689 |
| Immigrants | Hungary | 98.8 /100 | #84 | Exceptional $111,378 |
| Croatians | 98.8 /100 | #85 | Exceptional $111,370 |
| Ukrainians | 98.8 /100 | #86 | Exceptional $111,368 |
| Austrians | 98.8 /100 | #87 | Exceptional $111,306 |
| Romanians | 98.8 /100 | #88 | Exceptional $111,243 |
| Immigrants | Argentina | 98.5 /100 | #89 | Exceptional $110,873 |
| Northern Europeans | 98.3 /100 | #90 | Exceptional $110,635 |
| Immigrants | Southern Europe | 98.3 /100 | #91 | Exceptional $110,614 |
| Immigrants | Lebanon | 97.9 /100 | #92 | Exceptional $110,159 |
| Immigrants | Kazakhstan | 97.8 /100 | #93 | Exceptional $110,137 |
| Koreans | 97.8 /100 | #94 | Exceptional $110,103 |
| Zimbabweans | 97.7 /100 | #95 | Exceptional $110,011 |
| Immigrants | Moldova | 97.7 /100 | #96 | Exceptional $109,975 |
| Jordanians | 97.5 /100 | #97 | Exceptional $109,865 |
Demographics Similar to Haitians by Median Family Income
In terms of median family income, the demographic groups most similar to Haitians are U.S. Virgin Islander ($85,294, a difference of 0.090%), Chickasaw ($85,356, a difference of 0.16%), Immigrants from Central America ($85,050, a difference of 0.20%), Paiute ($85,414, a difference of 0.23%), and Immigrants from Dominica ($85,411, a difference of 0.23%).
| Demographics | Rating | Rank | Median Family Income |
| Spanish American Indians | 0.0 /100 | #302 | Tragic $85,728 |
| Hispanics or Latinos | 0.0 /100 | #303 | Tragic $85,647 |
| Mexicans | 0.0 /100 | #304 | Tragic $85,618 |
| Paiute | 0.0 /100 | #305 | Tragic $85,414 |
| Immigrants | Dominica | 0.0 /100 | #306 | Tragic $85,411 |
| Chickasaw | 0.0 /100 | #307 | Tragic $85,356 |
| U.S. Virgin Islanders | 0.0 /100 | #308 | Tragic $85,294 |
| Haitians | 0.0 /100 | #309 | Tragic $85,218 |
| Immigrants | Central America | 0.0 /100 | #310 | Tragic $85,050 |
| Hondurans | 0.0 /100 | #311 | Tragic $85,004 |
| Cubans | 0.0 /100 | #312 | Tragic $84,981 |
| Choctaw | 0.0 /100 | #313 | Tragic $84,835 |
| Immigrants | Bahamas | 0.0 /100 | #314 | Tragic $84,732 |
| Apache | 0.0 /100 | #315 | Tragic $84,451 |
| Immigrants | Haiti | 0.0 /100 | #316 | Tragic $84,018 |