Hopi vs Haitian Median Family Income
COMPARE
Hopi
Haitian
Median Family Income
Median Family Income Comparison
Hopi
Haitians
$77,188
MEDIAN FAMILY INCOME
0.0/ 100
METRIC RATING
340th/ 347
METRIC RANK
$85,218
MEDIAN FAMILY INCOME
0.0/ 100
METRIC RATING
309th/ 347
METRIC RANK
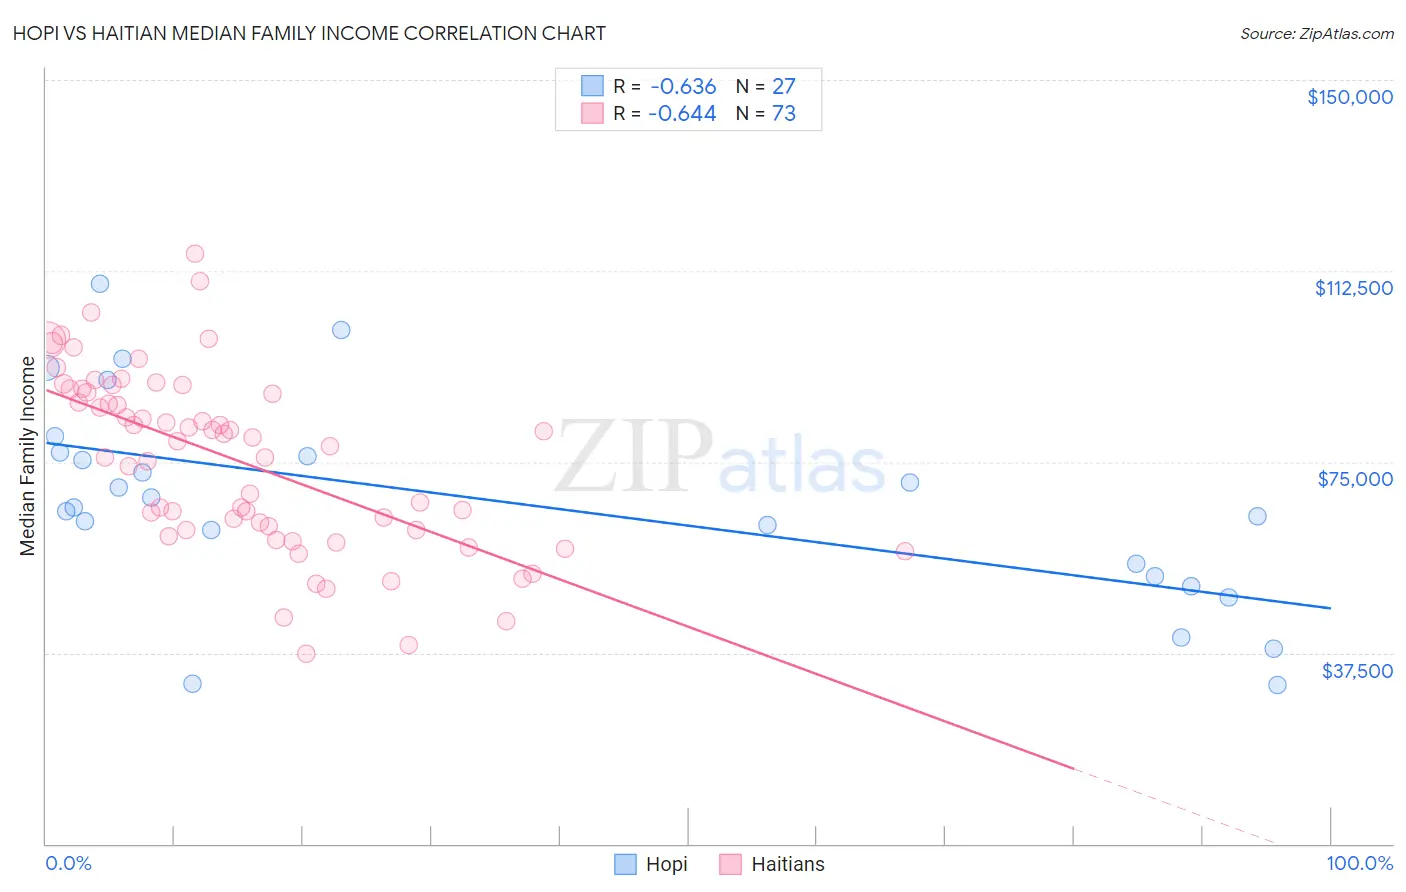
Hopi vs Haitian Median Family Income Correlation Chart
The statistical analysis conducted on geographies consisting of 74,729,125 people shows a significant negative correlation between the proportion of Hopi and median family income in the United States with a correlation coefficient (R) of -0.636 and weighted average of $77,188. Similarly, the statistical analysis conducted on geographies consisting of 287,578,429 people shows a significant negative correlation between the proportion of Haitians and median family income in the United States with a correlation coefficient (R) of -0.644 and weighted average of $85,218, a difference of 10.4%.
Median Family Income Correlation Summary
| Measurement | Hopi | Haitian |
| Minimum | $31,250 | $37,244 |
| Maximum | $109,922 | $115,792 |
| Range | $78,672 | $78,548 |
| Mean | $67,112 | $75,276 |
| Median | $66,093 | $79,021 |
| Interquartile 25% (IQ1) | $52,500 | $61,587 |
| Interquartile 75% (IQ3) | $76,955 | $88,995 |
| Interquartile Range (IQR) | $24,455 | $27,408 |
| Standard Deviation (Sample) | $20,243 | $17,405 |
| Standard Deviation (Population) | $19,865 | $17,285 |
Similar Demographics by Median Family Income
Demographics Similar to Hopi by Median Family Income
In terms of median family income, the demographic groups most similar to Hopi are Pima ($77,431, a difference of 0.32%), Immigrants from Yemen ($77,457, a difference of 0.35%), Pueblo ($76,880, a difference of 0.40%), Crow ($76,605, a difference of 0.76%), and Yuman ($78,055, a difference of 1.1%).
| Demographics | Rating | Rank | Median Family Income |
| Kiowa | 0.0 /100 | #333 | Tragic $80,885 |
| Menominee | 0.0 /100 | #334 | Tragic $79,563 |
| Yup'ik | 0.0 /100 | #335 | Tragic $79,290 |
| Immigrants | Cuba | 0.0 /100 | #336 | Tragic $78,249 |
| Yuman | 0.0 /100 | #337 | Tragic $78,055 |
| Immigrants | Yemen | 0.0 /100 | #338 | Tragic $77,457 |
| Pima | 0.0 /100 | #339 | Tragic $77,431 |
| Hopi | 0.0 /100 | #340 | Tragic $77,188 |
| Pueblo | 0.0 /100 | #341 | Tragic $76,880 |
| Crow | 0.0 /100 | #342 | Tragic $76,605 |
| Houma | 0.0 /100 | #343 | Tragic $76,188 |
| Tohono O'odham | 0.0 /100 | #344 | Tragic $72,193 |
| Navajo | 0.0 /100 | #345 | Tragic $70,989 |
| Puerto Ricans | 0.0 /100 | #346 | Tragic $70,423 |
| Lumbee | 0.0 /100 | #347 | Tragic $68,679 |
Demographics Similar to Haitians by Median Family Income
In terms of median family income, the demographic groups most similar to Haitians are U.S. Virgin Islander ($85,294, a difference of 0.090%), Chickasaw ($85,356, a difference of 0.16%), Immigrants from Central America ($85,050, a difference of 0.20%), Paiute ($85,414, a difference of 0.23%), and Immigrants from Dominica ($85,411, a difference of 0.23%).
| Demographics | Rating | Rank | Median Family Income |
| Spanish American Indians | 0.0 /100 | #302 | Tragic $85,728 |
| Hispanics or Latinos | 0.0 /100 | #303 | Tragic $85,647 |
| Mexicans | 0.0 /100 | #304 | Tragic $85,618 |
| Paiute | 0.0 /100 | #305 | Tragic $85,414 |
| Immigrants | Dominica | 0.0 /100 | #306 | Tragic $85,411 |
| Chickasaw | 0.0 /100 | #307 | Tragic $85,356 |
| U.S. Virgin Islanders | 0.0 /100 | #308 | Tragic $85,294 |
| Haitians | 0.0 /100 | #309 | Tragic $85,218 |
| Immigrants | Central America | 0.0 /100 | #310 | Tragic $85,050 |
| Hondurans | 0.0 /100 | #311 | Tragic $85,004 |
| Cubans | 0.0 /100 | #312 | Tragic $84,981 |
| Choctaw | 0.0 /100 | #313 | Tragic $84,835 |
| Immigrants | Bahamas | 0.0 /100 | #314 | Tragic $84,732 |
| Apache | 0.0 /100 | #315 | Tragic $84,451 |
| Immigrants | Haiti | 0.0 /100 | #316 | Tragic $84,018 |