Nonimmigrants vs Lumbee Median Female Earnings
COMPARE
Nonimmigrants
Lumbee
Median Female Earnings
Median Female Earnings Comparison
Nonimmigrants
Lumbee
$37,024
MEDIAN FEMALE EARNINGS
0.4/ 100
METRIC RATING
267th/ 347
METRIC RANK
$32,500
MEDIAN FEMALE EARNINGS
0.0/ 100
METRIC RATING
344th/ 347
METRIC RANK
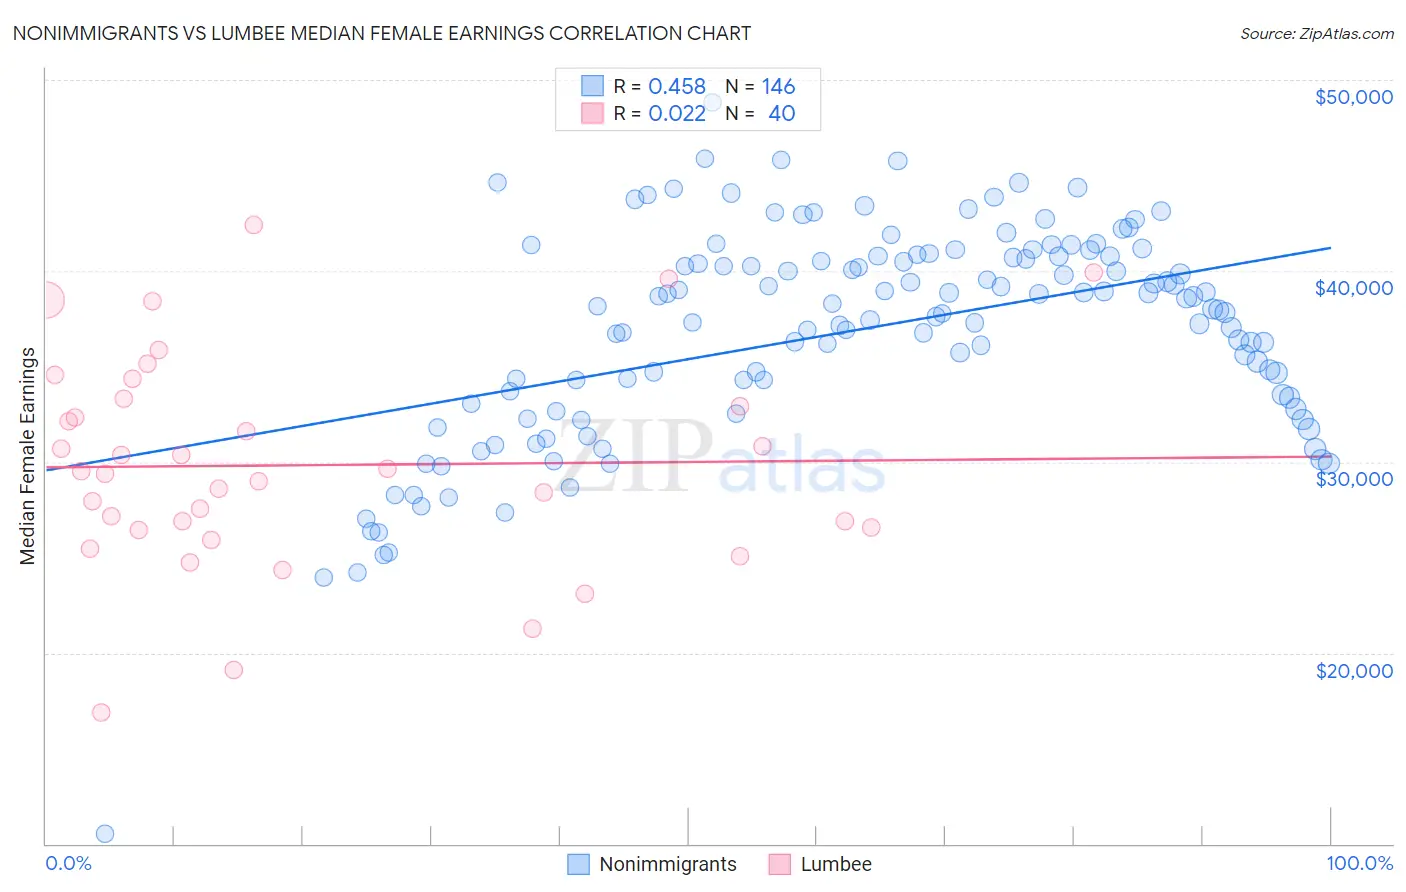
Nonimmigrants vs Lumbee Median Female Earnings Correlation Chart
The statistical analysis conducted on geographies consisting of 581,449,824 people shows a moderate positive correlation between the proportion of Nonimmigrants and median female earnings in the United States with a correlation coefficient (R) of 0.458 and weighted average of $37,024. Similarly, the statistical analysis conducted on geographies consisting of 92,259,660 people shows no correlation between the proportion of Lumbee and median female earnings in the United States with a correlation coefficient (R) of 0.022 and weighted average of $32,500, a difference of 13.9%.
Median Female Earnings Correlation Summary
| Measurement | Nonimmigrants | Lumbee |
| Minimum | $10,532 | $16,874 |
| Maximum | $48,847 | $42,434 |
| Range | $38,315 | $25,560 |
| Mean | $36,884 | $29,823 |
| Median | $38,067 | $29,442 |
| Interquartile 25% (IQ1) | $33,375 | $26,496 |
| Interquartile 75% (IQ3) | $40,787 | $33,125 |
| Interquartile Range (IQR) | $7,412 | $6,629 |
| Standard Deviation (Sample) | $5,653 | $5,605 |
| Standard Deviation (Population) | $5,634 | $5,534 |
Similar Demographics by Median Female Earnings
Demographics Similar to Nonimmigrants by Median Female Earnings
In terms of median female earnings, the demographic groups most similar to Nonimmigrants are Cree ($37,018, a difference of 0.010%), Dominican ($37,046, a difference of 0.060%), Immigrants from Venezuela ($37,003, a difference of 0.060%), Immigrants from Belize ($37,056, a difference of 0.090%), and Salvadoran ($37,083, a difference of 0.16%).
| Demographics | Rating | Rank | Median Female Earnings |
| Dutch | 0.7 /100 | #260 | Tragic $37,339 |
| Malaysians | 0.7 /100 | #261 | Tragic $37,298 |
| Venezuelans | 0.7 /100 | #262 | Tragic $37,282 |
| German Russians | 0.5 /100 | #263 | Tragic $37,105 |
| Salvadorans | 0.4 /100 | #264 | Tragic $37,083 |
| Immigrants | Belize | 0.4 /100 | #265 | Tragic $37,056 |
| Dominicans | 0.4 /100 | #266 | Tragic $37,046 |
| Immigrants | Nonimmigrants | 0.4 /100 | #267 | Tragic $37,024 |
| Cree | 0.4 /100 | #268 | Tragic $37,018 |
| Immigrants | Venezuela | 0.4 /100 | #269 | Tragic $37,003 |
| French American Indians | 0.3 /100 | #270 | Tragic $36,920 |
| Nicaraguans | 0.3 /100 | #271 | Tragic $36,904 |
| Immigrants | Dominican Republic | 0.3 /100 | #272 | Tragic $36,857 |
| Immigrants | Laos | 0.3 /100 | #273 | Tragic $36,841 |
| Immigrants | El Salvador | 0.2 /100 | #274 | Tragic $36,673 |
Demographics Similar to Lumbee by Median Female Earnings
In terms of median female earnings, the demographic groups most similar to Lumbee are Pueblo ($32,564, a difference of 0.20%), Yup'ik ($32,730, a difference of 0.71%), Navajo ($33,046, a difference of 1.7%), Tohono O'odham ($33,205, a difference of 2.2%), and Immigrants from Mexico ($33,236, a difference of 2.3%).
| Demographics | Rating | Rank | Median Female Earnings |
| Mexicans | 0.0 /100 | #333 | Tragic $33,664 |
| Spanish American Indians | 0.0 /100 | #334 | Tragic $33,625 |
| Creek | 0.0 /100 | #335 | Tragic $33,437 |
| Ottawa | 0.0 /100 | #336 | Tragic $33,378 |
| Yakama | 0.0 /100 | #337 | Tragic $33,354 |
| Immigrants | Cuba | 0.0 /100 | #338 | Tragic $33,291 |
| Immigrants | Mexico | 0.0 /100 | #339 | Tragic $33,236 |
| Tohono O'odham | 0.0 /100 | #340 | Tragic $33,205 |
| Navajo | 0.0 /100 | #341 | Tragic $33,046 |
| Yup'ik | 0.0 /100 | #342 | Tragic $32,730 |
| Pueblo | 0.0 /100 | #343 | Tragic $32,564 |
| Lumbee | 0.0 /100 | #344 | Tragic $32,500 |
| Puerto Ricans | 0.0 /100 | #345 | Tragic $31,560 |
| Arapaho | 0.0 /100 | #346 | Tragic $31,489 |
| Houma | 0.0 /100 | #347 | Tragic $30,343 |