Nonimmigrants vs Immigrants from Philippines Median Female Earnings
COMPARE
Nonimmigrants
Immigrants from Philippines
Median Female Earnings
Median Female Earnings Comparison
Nonimmigrants
Immigrants from Philippines
$37,024
MEDIAN FEMALE EARNINGS
0.4/ 100
METRIC RATING
267th/ 347
METRIC RANK
$41,114
MEDIAN FEMALE EARNINGS
95.0/ 100
METRIC RATING
119th/ 347
METRIC RANK
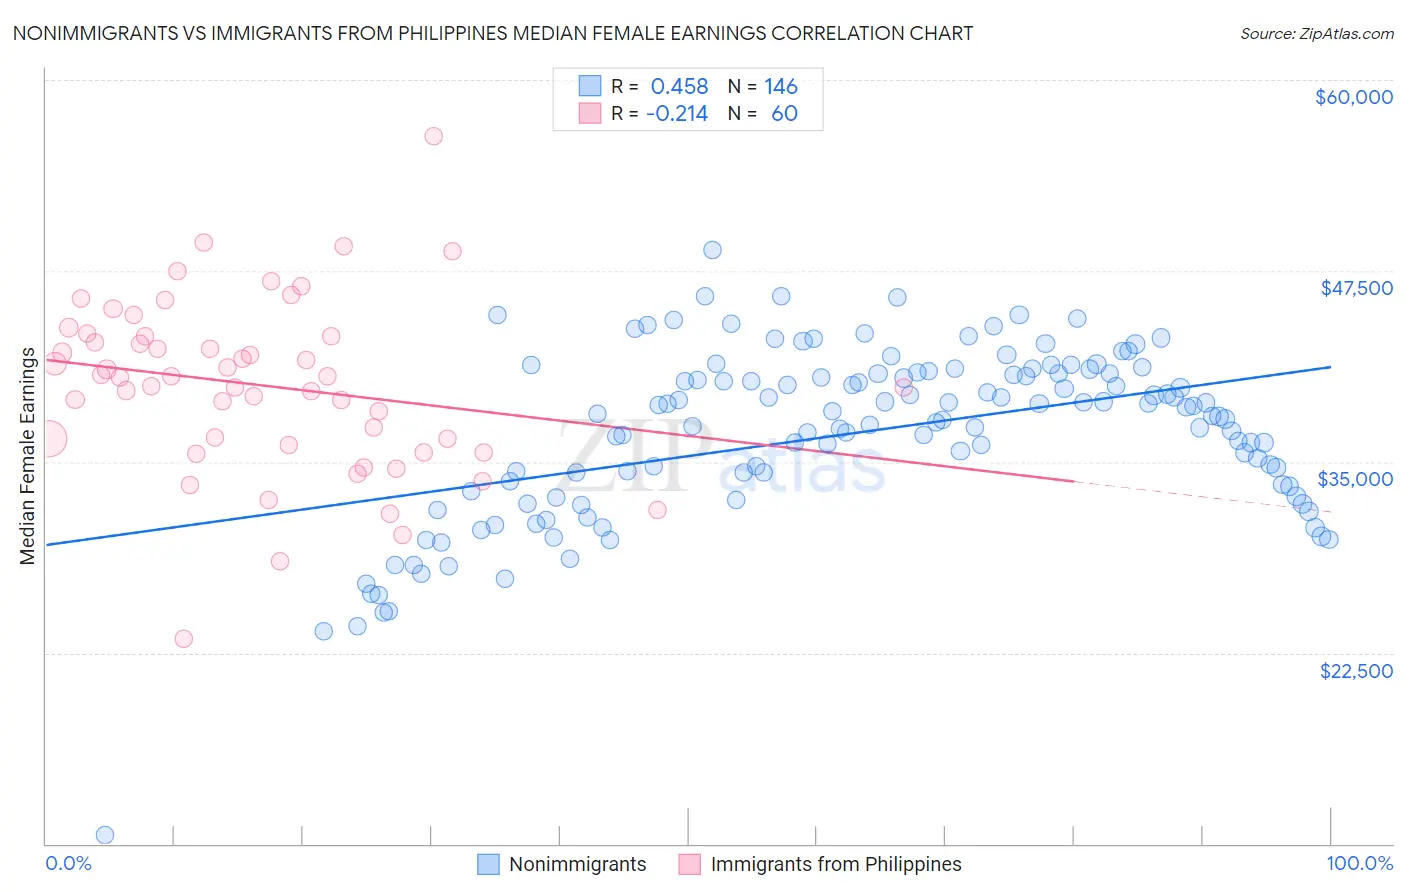
Nonimmigrants vs Immigrants from Philippines Median Female Earnings Correlation Chart
The statistical analysis conducted on geographies consisting of 581,449,824 people shows a moderate positive correlation between the proportion of Nonimmigrants and median female earnings in the United States with a correlation coefficient (R) of 0.458 and weighted average of $37,024. Similarly, the statistical analysis conducted on geographies consisting of 470,999,138 people shows a weak negative correlation between the proportion of Immigrants from Philippines and median female earnings in the United States with a correlation coefficient (R) of -0.214 and weighted average of $41,114, a difference of 11.1%.
Median Female Earnings Correlation Summary
| Measurement | Nonimmigrants | Immigrants from Philippines |
| Minimum | $10,532 | $23,405 |
| Maximum | $48,847 | $56,354 |
| Range | $38,315 | $32,949 |
| Mean | $36,884 | $40,018 |
| Median | $38,067 | $40,572 |
| Interquartile 25% (IQ1) | $33,375 | $36,304 |
| Interquartile 75% (IQ3) | $40,787 | $43,216 |
| Interquartile Range (IQR) | $7,412 | $6,912 |
| Standard Deviation (Sample) | $5,653 | $5,659 |
| Standard Deviation (Population) | $5,634 | $5,612 |
Similar Demographics by Median Female Earnings
Demographics Similar to Nonimmigrants by Median Female Earnings
In terms of median female earnings, the demographic groups most similar to Nonimmigrants are Cree ($37,018, a difference of 0.010%), Dominican ($37,046, a difference of 0.060%), Immigrants from Venezuela ($37,003, a difference of 0.060%), Immigrants from Belize ($37,056, a difference of 0.090%), and Salvadoran ($37,083, a difference of 0.16%).
| Demographics | Rating | Rank | Median Female Earnings |
| Dutch | 0.7 /100 | #260 | Tragic $37,339 |
| Malaysians | 0.7 /100 | #261 | Tragic $37,298 |
| Venezuelans | 0.7 /100 | #262 | Tragic $37,282 |
| German Russians | 0.5 /100 | #263 | Tragic $37,105 |
| Salvadorans | 0.4 /100 | #264 | Tragic $37,083 |
| Immigrants | Belize | 0.4 /100 | #265 | Tragic $37,056 |
| Dominicans | 0.4 /100 | #266 | Tragic $37,046 |
| Immigrants | Nonimmigrants | 0.4 /100 | #267 | Tragic $37,024 |
| Cree | 0.4 /100 | #268 | Tragic $37,018 |
| Immigrants | Venezuela | 0.4 /100 | #269 | Tragic $37,003 |
| French American Indians | 0.3 /100 | #270 | Tragic $36,920 |
| Nicaraguans | 0.3 /100 | #271 | Tragic $36,904 |
| Immigrants | Dominican Republic | 0.3 /100 | #272 | Tragic $36,857 |
| Immigrants | Laos | 0.3 /100 | #273 | Tragic $36,841 |
| Immigrants | El Salvador | 0.2 /100 | #274 | Tragic $36,673 |
Demographics Similar to Immigrants from Philippines by Median Female Earnings
In terms of median female earnings, the demographic groups most similar to Immigrants from Philippines are Immigrants from Kuwait ($41,055, a difference of 0.15%), Immigrants from Lebanon ($41,183, a difference of 0.17%), Croatian ($40,993, a difference of 0.30%), Immigrants from Jordan ($40,977, a difference of 0.33%), and Guyanese ($40,973, a difference of 0.34%).
| Demographics | Rating | Rank | Median Female Earnings |
| Immigrants | North America | 96.7 /100 | #112 | Exceptional $41,319 |
| Macedonians | 96.4 /100 | #113 | Exceptional $41,286 |
| Immigrants | England | 96.4 /100 | #114 | Exceptional $41,277 |
| Koreans | 96.4 /100 | #115 | Exceptional $41,276 |
| Immigrants | Brazil | 96.4 /100 | #116 | Exceptional $41,273 |
| Barbadians | 96.3 /100 | #117 | Exceptional $41,261 |
| Immigrants | Lebanon | 95.6 /100 | #118 | Exceptional $41,183 |
| Immigrants | Philippines | 95.0 /100 | #119 | Exceptional $41,114 |
| Immigrants | Kuwait | 94.4 /100 | #120 | Exceptional $41,055 |
| Croatians | 93.7 /100 | #121 | Exceptional $40,993 |
| Immigrants | Jordan | 93.5 /100 | #122 | Exceptional $40,977 |
| Guyanese | 93.4 /100 | #123 | Exceptional $40,973 |
| Trinidadians and Tobagonians | 93.2 /100 | #124 | Exceptional $40,958 |
| Austrians | 92.7 /100 | #125 | Exceptional $40,923 |
| Immigrants | Trinidad and Tobago | 92.3 /100 | #126 | Exceptional $40,895 |