Nigerian vs Cheyenne Median Female Earnings
COMPARE
Nigerian
Cheyenne
Median Female Earnings
Median Female Earnings Comparison
Nigerians
Cheyenne
$39,641
MEDIAN FEMALE EARNINGS
47.0/ 100
METRIC RATING
176th/ 347
METRIC RANK
$35,673
MEDIAN FEMALE EARNINGS
0.0/ 100
METRIC RATING
294th/ 347
METRIC RANK
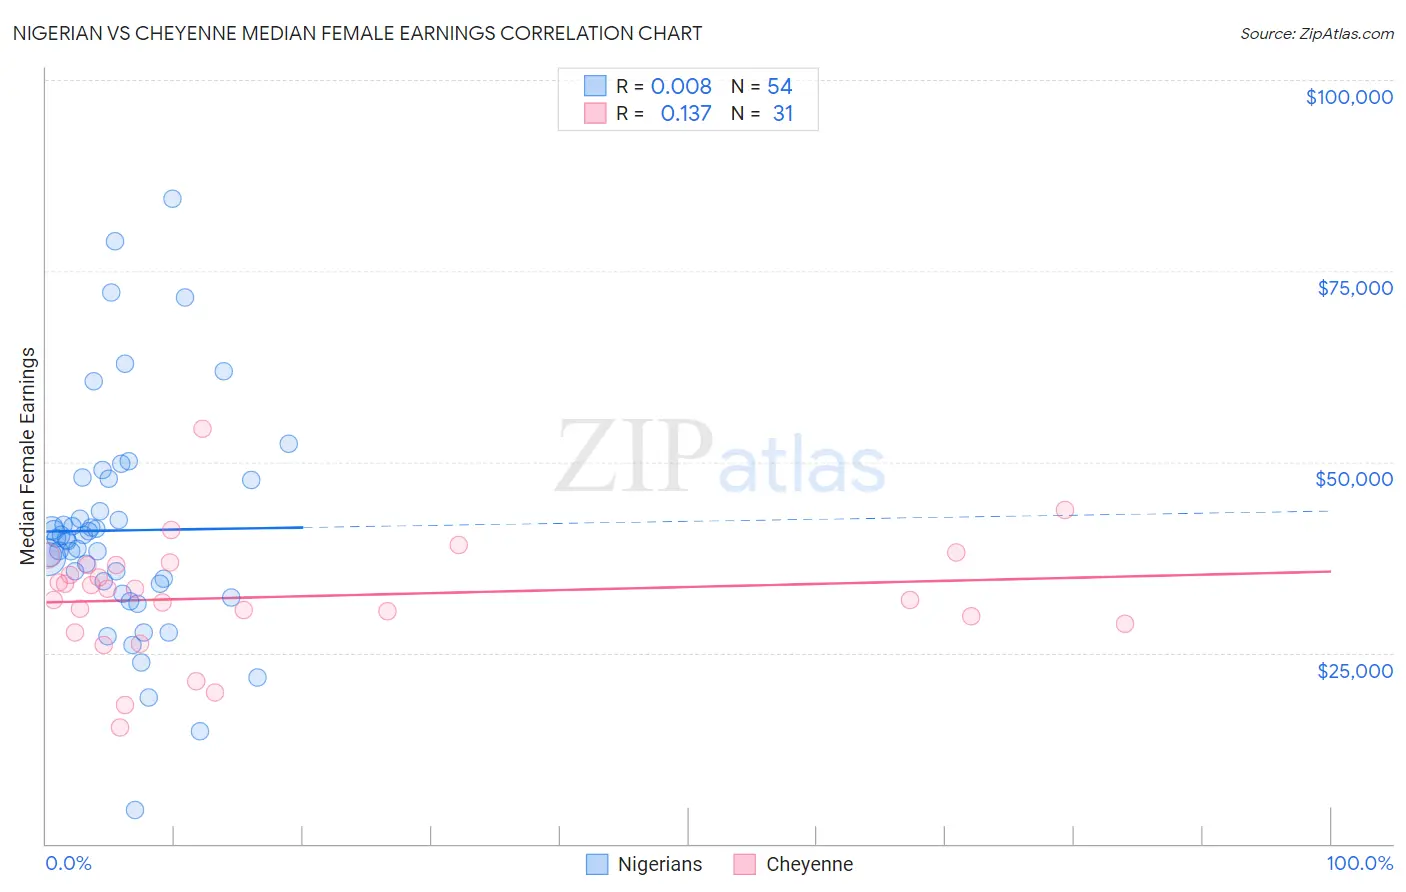
Nigerian vs Cheyenne Median Female Earnings Correlation Chart
The statistical analysis conducted on geographies consisting of 332,727,329 people shows no correlation between the proportion of Nigerians and median female earnings in the United States with a correlation coefficient (R) of 0.008 and weighted average of $39,641. Similarly, the statistical analysis conducted on geographies consisting of 80,682,287 people shows a poor positive correlation between the proportion of Cheyenne and median female earnings in the United States with a correlation coefficient (R) of 0.137 and weighted average of $35,673, a difference of 11.1%.
Median Female Earnings Correlation Summary
| Measurement | Nigerian | Cheyenne |
| Minimum | $4,391 | $15,218 |
| Maximum | $84,500 | $54,333 |
| Range | $80,109 | $39,115 |
| Mean | $41,029 | $32,359 |
| Median | $39,924 | $33,313 |
| Interquartile 25% (IQ1) | $33,961 | $28,775 |
| Interquartile 75% (IQ3) | $47,567 | $36,563 |
| Interquartile Range (IQR) | $13,606 | $7,788 |
| Standard Deviation (Sample) | $14,779 | $7,704 |
| Standard Deviation (Population) | $14,642 | $7,579 |
Similar Demographics by Median Female Earnings
Demographics Similar to Nigerians by Median Female Earnings
In terms of median female earnings, the demographic groups most similar to Nigerians are Immigrants from South America ($39,643, a difference of 0.010%), Costa Rican ($39,622, a difference of 0.050%), Slavic ($39,613, a difference of 0.070%), Immigrants from Germany ($39,603, a difference of 0.10%), and South American ($39,698, a difference of 0.14%).
| Demographics | Rating | Rank | Median Female Earnings |
| Kenyans | 58.4 /100 | #169 | Average $39,860 |
| Slovenes | 56.2 /100 | #170 | Average $39,817 |
| Immigrants | Portugal | 54.7 /100 | #171 | Average $39,788 |
| British | 53.8 /100 | #172 | Average $39,772 |
| Canadians | 51.4 /100 | #173 | Average $39,724 |
| South Americans | 50.0 /100 | #174 | Average $39,698 |
| Immigrants | South America | 47.2 /100 | #175 | Average $39,643 |
| Nigerians | 47.0 /100 | #176 | Average $39,641 |
| Costa Ricans | 46.1 /100 | #177 | Average $39,622 |
| Slavs | 45.6 /100 | #178 | Average $39,613 |
| Immigrants | Germany | 45.1 /100 | #179 | Average $39,603 |
| Immigrants | Kenya | 41.6 /100 | #180 | Average $39,535 |
| Tsimshian | 41.4 /100 | #181 | Average $39,530 |
| Tlingit-Haida | 40.5 /100 | #182 | Average $39,513 |
| Hungarians | 40.3 /100 | #183 | Average $39,510 |
Demographics Similar to Cheyenne by Median Female Earnings
In terms of median female earnings, the demographic groups most similar to Cheyenne are Comanche ($35,661, a difference of 0.030%), Guatemalan ($35,695, a difference of 0.060%), Mexican American Indian ($35,629, a difference of 0.12%), American ($35,777, a difference of 0.29%), and Hmong ($35,498, a difference of 0.49%).
| Demographics | Rating | Rank | Median Female Earnings |
| Immigrants | Nicaragua | 0.0 /100 | #287 | Tragic $36,023 |
| Immigrants | Zaire | 0.0 /100 | #288 | Tragic $36,017 |
| Bangladeshis | 0.0 /100 | #289 | Tragic $35,960 |
| Central American Indians | 0.0 /100 | #290 | Tragic $35,930 |
| Blackfeet | 0.0 /100 | #291 | Tragic $35,864 |
| Americans | 0.0 /100 | #292 | Tragic $35,777 |
| Guatemalans | 0.0 /100 | #293 | Tragic $35,695 |
| Cheyenne | 0.0 /100 | #294 | Tragic $35,673 |
| Comanche | 0.0 /100 | #295 | Tragic $35,661 |
| Mexican American Indians | 0.0 /100 | #296 | Tragic $35,629 |
| Hmong | 0.0 /100 | #297 | Tragic $35,498 |
| Immigrants | Micronesia | 0.0 /100 | #298 | Tragic $35,477 |
| Immigrants | Guatemala | 0.0 /100 | #299 | Tragic $35,444 |
| Yuman | 0.0 /100 | #300 | Tragic $35,377 |
| Pima | 0.0 /100 | #301 | Tragic $35,326 |