Immigrants from Caribbean vs Cheyenne Median Female Earnings
COMPARE
Immigrants from Caribbean
Cheyenne
Median Female Earnings
Median Female Earnings Comparison
Immigrants from Caribbean
Cheyenne
$36,414
MEDIAN FEMALE EARNINGS
0.1/ 100
METRIC RATING
279th/ 347
METRIC RANK
$35,673
MEDIAN FEMALE EARNINGS
0.0/ 100
METRIC RATING
294th/ 347
METRIC RANK
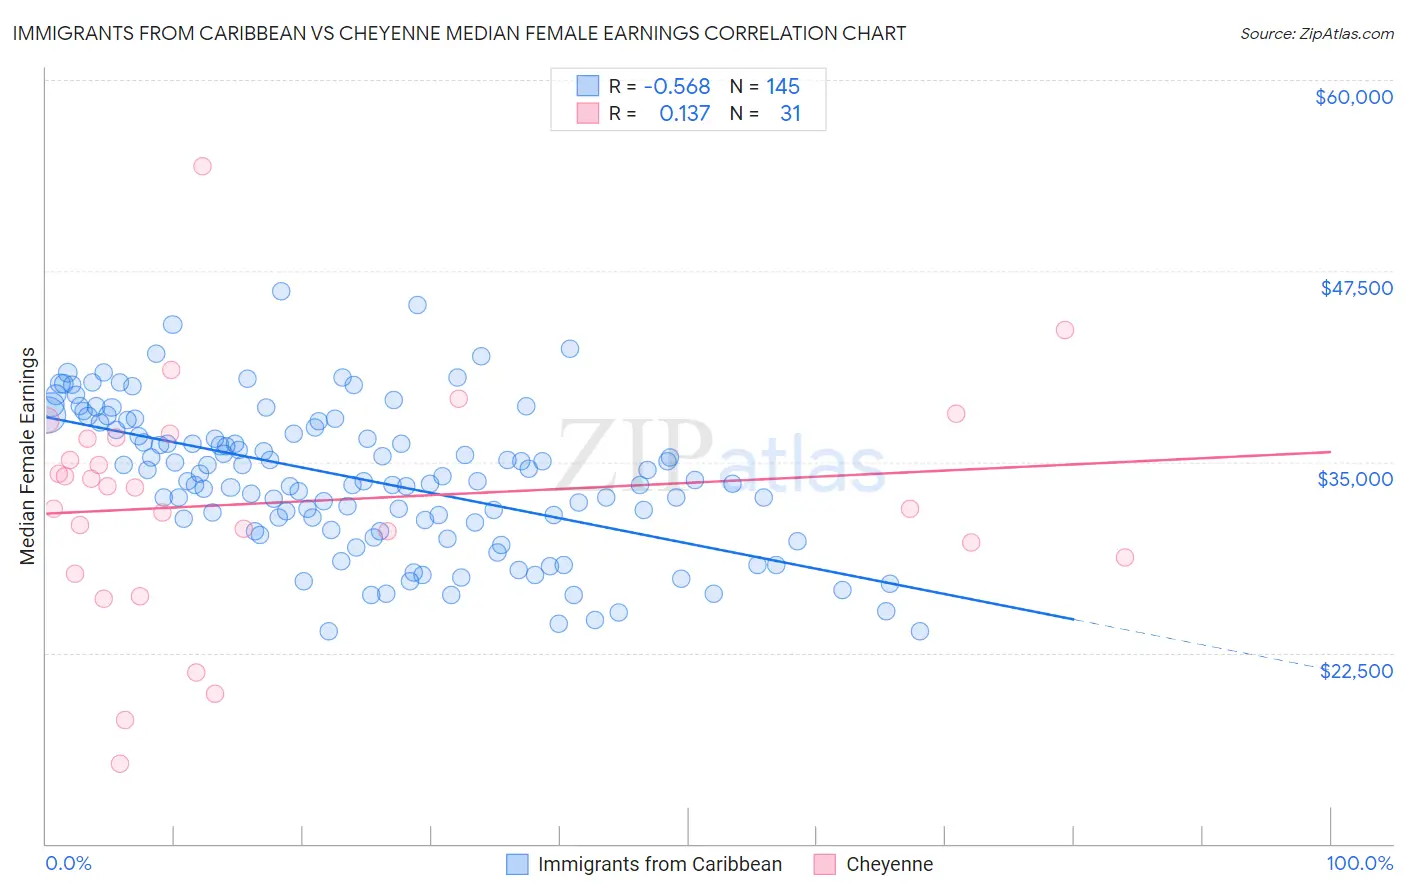
Immigrants from Caribbean vs Cheyenne Median Female Earnings Correlation Chart
The statistical analysis conducted on geographies consisting of 449,719,186 people shows a substantial negative correlation between the proportion of Immigrants from Caribbean and median female earnings in the United States with a correlation coefficient (R) of -0.568 and weighted average of $36,414. Similarly, the statistical analysis conducted on geographies consisting of 80,682,287 people shows a poor positive correlation between the proportion of Cheyenne and median female earnings in the United States with a correlation coefficient (R) of 0.137 and weighted average of $35,673, a difference of 2.1%.
Median Female Earnings Correlation Summary
| Measurement | Immigrants from Caribbean | Cheyenne |
| Minimum | $23,937 | $15,218 |
| Maximum | $46,205 | $54,333 |
| Range | $22,268 | $39,115 |
| Mean | $33,887 | $32,359 |
| Median | $33,768 | $33,313 |
| Interquartile 25% (IQ1) | $30,791 | $28,775 |
| Interquartile 75% (IQ3) | $37,444 | $36,563 |
| Interquartile Range (IQR) | $6,654 | $7,788 |
| Standard Deviation (Sample) | $4,730 | $7,704 |
| Standard Deviation (Population) | $4,714 | $7,579 |
Demographics Similar to Immigrants from Caribbean and Cheyenne by Median Female Earnings
In terms of median female earnings, the demographic groups most similar to Immigrants from Caribbean are Iroquois ($36,408, a difference of 0.020%), U.S. Virgin Islander ($36,424, a difference of 0.030%), Spanish American ($36,391, a difference of 0.060%), Haitian ($36,374, a difference of 0.11%), and Marshallese ($36,459, a difference of 0.12%). Similarly, the demographic groups most similar to Cheyenne are Comanche ($35,661, a difference of 0.030%), Guatemalan ($35,695, a difference of 0.060%), Mexican American Indian ($35,629, a difference of 0.12%), American ($35,777, a difference of 0.29%), and Blackfeet ($35,864, a difference of 0.54%).
| Demographics | Rating | Rank | Median Female Earnings |
| Central Americans | 0.1 /100 | #276 | Tragic $36,492 |
| Marshallese | 0.1 /100 | #277 | Tragic $36,459 |
| U.S. Virgin Islanders | 0.1 /100 | #278 | Tragic $36,424 |
| Immigrants | Caribbean | 0.1 /100 | #279 | Tragic $36,414 |
| Iroquois | 0.1 /100 | #280 | Tragic $36,408 |
| Spanish Americans | 0.1 /100 | #281 | Tragic $36,391 |
| Haitians | 0.1 /100 | #282 | Tragic $36,374 |
| Immigrants | Haiti | 0.1 /100 | #283 | Tragic $36,203 |
| Indonesians | 0.1 /100 | #284 | Tragic $36,140 |
| Paiute | 0.1 /100 | #285 | Tragic $36,056 |
| Osage | 0.0 /100 | #286 | Tragic $36,034 |
| Immigrants | Nicaragua | 0.0 /100 | #287 | Tragic $36,023 |
| Immigrants | Zaire | 0.0 /100 | #288 | Tragic $36,017 |
| Bangladeshis | 0.0 /100 | #289 | Tragic $35,960 |
| Central American Indians | 0.0 /100 | #290 | Tragic $35,930 |
| Blackfeet | 0.0 /100 | #291 | Tragic $35,864 |
| Americans | 0.0 /100 | #292 | Tragic $35,777 |
| Guatemalans | 0.0 /100 | #293 | Tragic $35,695 |
| Cheyenne | 0.0 /100 | #294 | Tragic $35,673 |
| Comanche | 0.0 /100 | #295 | Tragic $35,661 |
| Mexican American Indians | 0.0 /100 | #296 | Tragic $35,629 |