Nepalese vs Trinidadian and Tobagonian Median Family Income
COMPARE
Nepalese
Trinidadian and Tobagonian
Median Family Income
Median Family Income Comparison
Nepalese
Trinidadians and Tobagonians
$94,153
MEDIAN FAMILY INCOME
1.3/ 100
METRIC RATING
238th/ 347
METRIC RANK
$94,466
MEDIAN FAMILY INCOME
1.5/ 100
METRIC RATING
236th/ 347
METRIC RANK
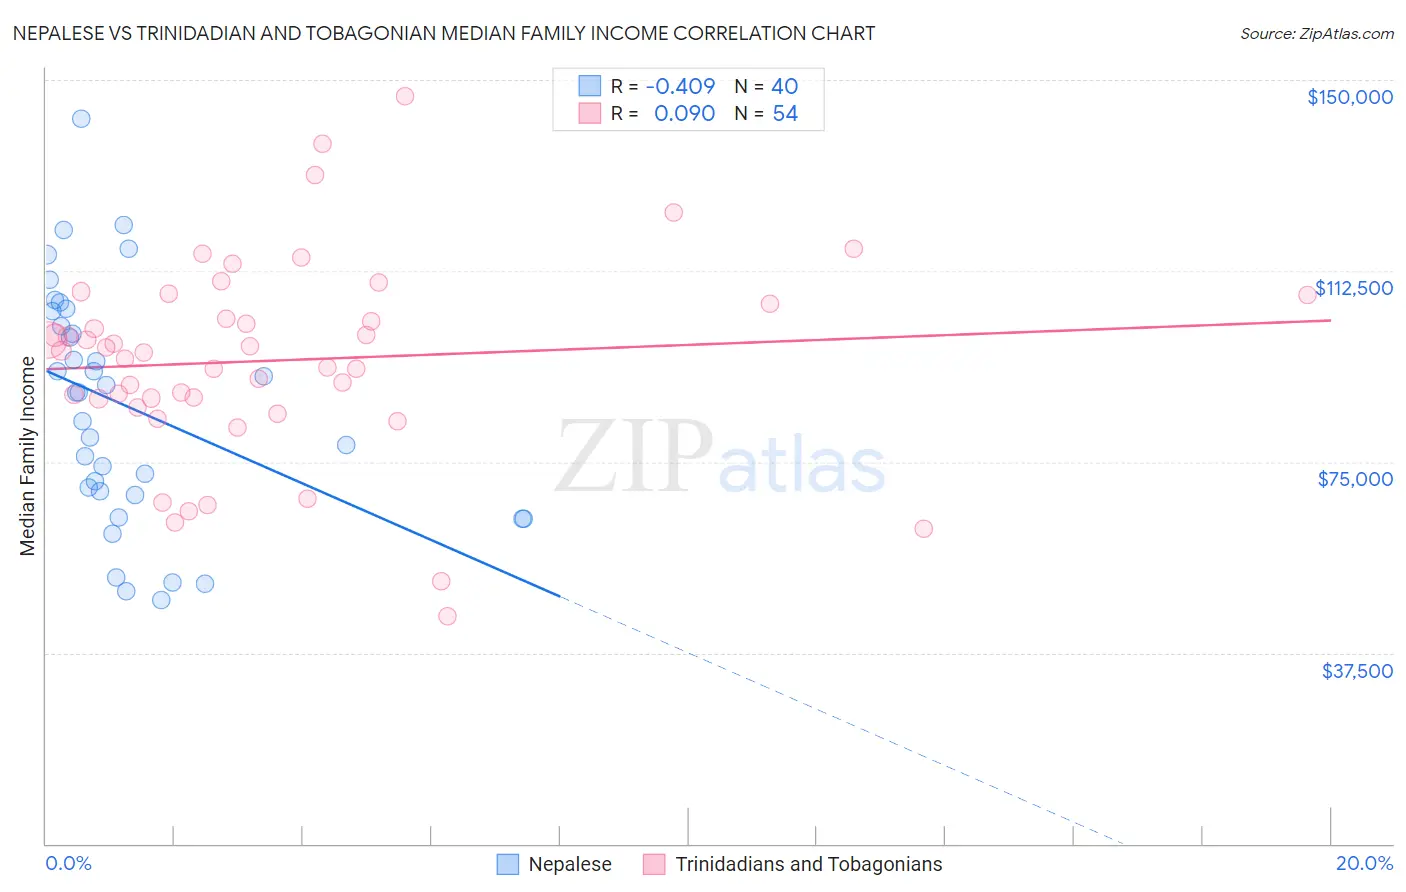
Nepalese vs Trinidadian and Tobagonian Median Family Income Correlation Chart
The statistical analysis conducted on geographies consisting of 24,521,755 people shows a moderate negative correlation between the proportion of Nepalese and median family income in the United States with a correlation coefficient (R) of -0.409 and weighted average of $94,153. Similarly, the statistical analysis conducted on geographies consisting of 219,638,345 people shows a slight positive correlation between the proportion of Trinidadians and Tobagonians and median family income in the United States with a correlation coefficient (R) of 0.090 and weighted average of $94,466, a difference of 0.33%.
Median Family Income Correlation Summary
| Measurement | Nepalese | Trinidadian and Tobagonian |
| Minimum | $47,952 | $44,583 |
| Maximum | $142,416 | $146,767 |
| Range | $94,464 | $102,184 |
| Mean | $85,857 | $94,928 |
| Median | $88,639 | $96,651 |
| Interquartile 25% (IQ1) | $68,953 | $87,494 |
| Interquartile 75% (IQ3) | $103,204 | $106,050 |
| Interquartile Range (IQR) | $34,251 | $18,556 |
| Standard Deviation (Sample) | $22,971 | $19,692 |
| Standard Deviation (Population) | $22,682 | $19,508 |
Demographics Similar to Nepalese and Trinidadians and Tobagonians by Median Family Income
In terms of median family income, the demographic groups most similar to Nepalese are Salvadoran ($94,109, a difference of 0.050%), Somali ($94,085, a difference of 0.070%), Immigrants from Trinidad and Tobago ($93,988, a difference of 0.17%), Barbadian ($93,919, a difference of 0.25%), and Alaskan Athabascan ($94,429, a difference of 0.29%). Similarly, the demographic groups most similar to Trinidadians and Tobagonians are Immigrants from Burma/Myanmar ($94,472, a difference of 0.010%), Alaskan Athabascan ($94,429, a difference of 0.040%), Immigrants from Western Africa ($94,638, a difference of 0.18%), Immigrants from Bangladesh ($94,665, a difference of 0.21%), and Salvadoran ($94,109, a difference of 0.38%).
| Demographics | Rating | Rank | Median Family Income |
| Alaska Natives | 2.6 /100 | #227 | Tragic $95,573 |
| Immigrants | Azores | 2.4 /100 | #228 | Tragic $95,402 |
| Marshallese | 2.2 /100 | #229 | Tragic $95,293 |
| Malaysians | 2.2 /100 | #230 | Tragic $95,230 |
| Ecuadorians | 2.1 /100 | #231 | Tragic $95,114 |
| Immigrants | Venezuela | 1.9 /100 | #232 | Tragic $94,904 |
| Immigrants | Bangladesh | 1.6 /100 | #233 | Tragic $94,665 |
| Immigrants | Western Africa | 1.6 /100 | #234 | Tragic $94,638 |
| Immigrants | Burma/Myanmar | 1.5 /100 | #235 | Tragic $94,472 |
| Trinidadians and Tobagonians | 1.5 /100 | #236 | Tragic $94,466 |
| Alaskan Athabascans | 1.5 /100 | #237 | Tragic $94,429 |
| Nepalese | 1.3 /100 | #238 | Tragic $94,153 |
| Salvadorans | 1.2 /100 | #239 | Tragic $94,109 |
| Somalis | 1.2 /100 | #240 | Tragic $94,085 |
| Immigrants | Trinidad and Tobago | 1.2 /100 | #241 | Tragic $93,988 |
| Barbadians | 1.1 /100 | #242 | Tragic $93,919 |
| German Russians | 1.1 /100 | #243 | Tragic $93,858 |
| Sub-Saharan Africans | 1.0 /100 | #244 | Tragic $93,748 |
| Immigrants | Middle Africa | 1.0 /100 | #245 | Tragic $93,593 |
| Guyanese | 0.9 /100 | #246 | Tragic $93,373 |
| Immigrants | Senegal | 0.7 /100 | #247 | Tragic $92,912 |