Colville vs Trinidadian and Tobagonian Median Family Income
COMPARE
Colville
Trinidadian and Tobagonian
Median Family Income
Median Family Income Comparison
Colville
Trinidadians and Tobagonians
$85,792
MEDIAN FAMILY INCOME
0.0/ 100
METRIC RATING
301st/ 347
METRIC RANK
$94,466
MEDIAN FAMILY INCOME
1.5/ 100
METRIC RATING
236th/ 347
METRIC RANK
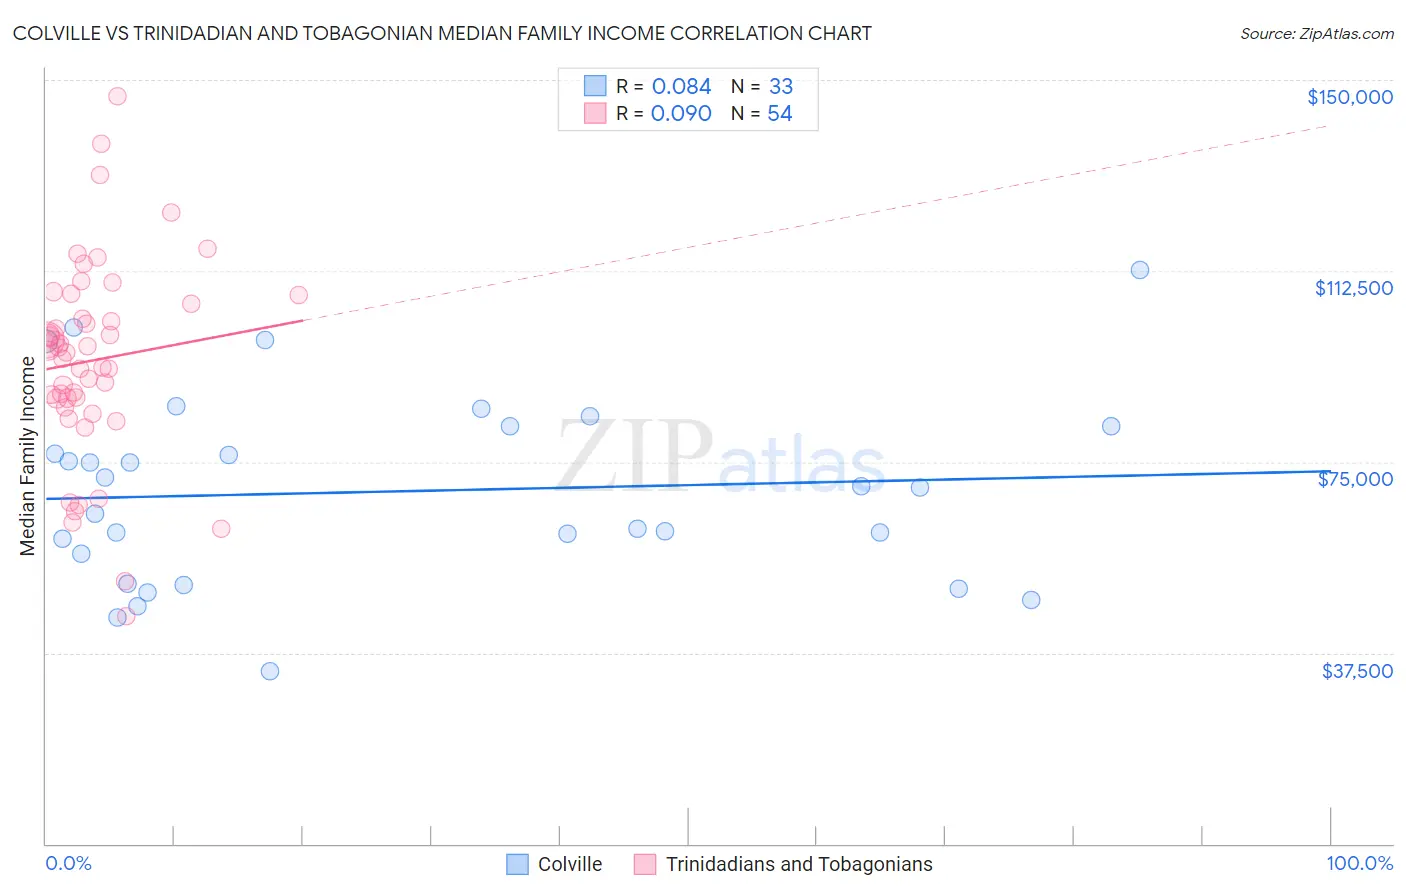
Colville vs Trinidadian and Tobagonian Median Family Income Correlation Chart
The statistical analysis conducted on geographies consisting of 34,680,416 people shows a slight positive correlation between the proportion of Colville and median family income in the United States with a correlation coefficient (R) of 0.084 and weighted average of $85,792. Similarly, the statistical analysis conducted on geographies consisting of 219,638,345 people shows a slight positive correlation between the proportion of Trinidadians and Tobagonians and median family income in the United States with a correlation coefficient (R) of 0.090 and weighted average of $94,466, a difference of 10.1%.
Median Family Income Correlation Summary
| Measurement | Colville | Trinidadian and Tobagonian |
| Minimum | $33,824 | $44,583 |
| Maximum | $112,639 | $146,767 |
| Range | $78,815 | $102,184 |
| Mean | $69,185 | $94,928 |
| Median | $70,000 | $96,651 |
| Interquartile 25% (IQ1) | $53,997 | $87,494 |
| Interquartile 75% (IQ3) | $82,061 | $106,050 |
| Interquartile Range (IQR) | $28,064 | $18,556 |
| Standard Deviation (Sample) | $18,382 | $19,692 |
| Standard Deviation (Population) | $18,102 | $19,508 |
Similar Demographics by Median Family Income
Demographics Similar to Colville by Median Family Income
In terms of median family income, the demographic groups most similar to Colville are Spanish American Indian ($85,728, a difference of 0.070%), Hispanic or Latino ($85,647, a difference of 0.17%), Mexican ($85,618, a difference of 0.20%), Paiute ($85,414, a difference of 0.44%), and Immigrants from Dominica ($85,411, a difference of 0.45%).
| Demographics | Rating | Rank | Median Family Income |
| Fijians | 0.0 /100 | #294 | Tragic $87,387 |
| Yaqui | 0.0 /100 | #295 | Tragic $87,289 |
| Immigrants | Guatemala | 0.0 /100 | #296 | Tragic $87,191 |
| Cajuns | 0.0 /100 | #297 | Tragic $87,157 |
| Immigrants | Latin America | 0.0 /100 | #298 | Tragic $86,989 |
| Chippewa | 0.0 /100 | #299 | Tragic $86,852 |
| Ottawa | 0.0 /100 | #300 | Tragic $86,380 |
| Colville | 0.0 /100 | #301 | Tragic $85,792 |
| Spanish American Indians | 0.0 /100 | #302 | Tragic $85,728 |
| Hispanics or Latinos | 0.0 /100 | #303 | Tragic $85,647 |
| Mexicans | 0.0 /100 | #304 | Tragic $85,618 |
| Paiute | 0.0 /100 | #305 | Tragic $85,414 |
| Immigrants | Dominica | 0.0 /100 | #306 | Tragic $85,411 |
| Chickasaw | 0.0 /100 | #307 | Tragic $85,356 |
| U.S. Virgin Islanders | 0.0 /100 | #308 | Tragic $85,294 |
Demographics Similar to Trinidadians and Tobagonians by Median Family Income
In terms of median family income, the demographic groups most similar to Trinidadians and Tobagonians are Immigrants from Burma/Myanmar ($94,472, a difference of 0.010%), Alaskan Athabascan ($94,429, a difference of 0.040%), Immigrants from Western Africa ($94,638, a difference of 0.18%), Immigrants from Bangladesh ($94,665, a difference of 0.21%), and Nepalese ($94,153, a difference of 0.33%).
| Demographics | Rating | Rank | Median Family Income |
| Marshallese | 2.2 /100 | #229 | Tragic $95,293 |
| Malaysians | 2.2 /100 | #230 | Tragic $95,230 |
| Ecuadorians | 2.1 /100 | #231 | Tragic $95,114 |
| Immigrants | Venezuela | 1.9 /100 | #232 | Tragic $94,904 |
| Immigrants | Bangladesh | 1.6 /100 | #233 | Tragic $94,665 |
| Immigrants | Western Africa | 1.6 /100 | #234 | Tragic $94,638 |
| Immigrants | Burma/Myanmar | 1.5 /100 | #235 | Tragic $94,472 |
| Trinidadians and Tobagonians | 1.5 /100 | #236 | Tragic $94,466 |
| Alaskan Athabascans | 1.5 /100 | #237 | Tragic $94,429 |
| Nepalese | 1.3 /100 | #238 | Tragic $94,153 |
| Salvadorans | 1.2 /100 | #239 | Tragic $94,109 |
| Somalis | 1.2 /100 | #240 | Tragic $94,085 |
| Immigrants | Trinidad and Tobago | 1.2 /100 | #241 | Tragic $93,988 |
| Barbadians | 1.1 /100 | #242 | Tragic $93,919 |
| German Russians | 1.1 /100 | #243 | Tragic $93,858 |