Nepalese vs Immigrants from Belarus Householder Income Ages 25 - 44 years
COMPARE
Nepalese
Immigrants from Belarus
Householder Income Ages 25 - 44 years
Householder Income Ages 25 - 44 years Comparison
Nepalese
Immigrants from Belarus
$91,498
HOUSEHOLDER INCOME AGES 25 - 44 YEARS
15.4/ 100
METRIC RATING
204th/ 347
METRIC RANK
$107,393
HOUSEHOLDER INCOME AGES 25 - 44 YEARS
99.9/ 100
METRIC RATING
46th/ 347
METRIC RANK
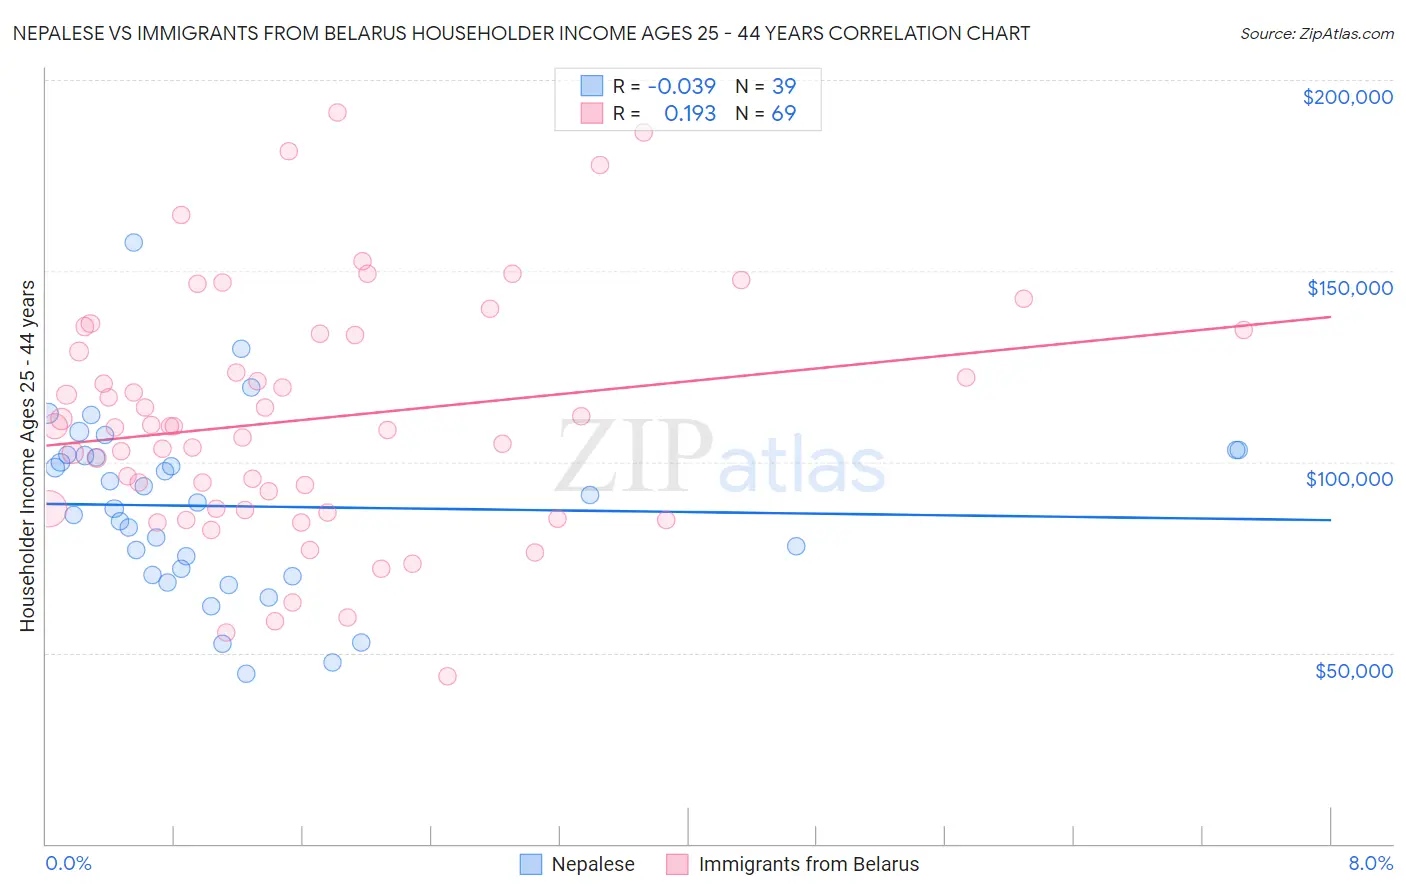
Nepalese vs Immigrants from Belarus Householder Income Ages 25 - 44 years Correlation Chart
The statistical analysis conducted on geographies consisting of 24,520,458 people shows no correlation between the proportion of Nepalese and household income with householder between the ages 25 and 44 in the United States with a correlation coefficient (R) of -0.039 and weighted average of $91,498. Similarly, the statistical analysis conducted on geographies consisting of 150,157,706 people shows a poor positive correlation between the proportion of Immigrants from Belarus and household income with householder between the ages 25 and 44 in the United States with a correlation coefficient (R) of 0.193 and weighted average of $107,393, a difference of 17.4%.
Householder Income Ages 25 - 44 years Correlation Summary
| Measurement | Nepalese | Immigrants from Belarus |
| Minimum | $44,671 | $43,724 |
| Maximum | $157,344 | $191,528 |
| Range | $112,673 | $147,804 |
| Mean | $88,333 | $111,122 |
| Median | $89,253 | $109,354 |
| Interquartile 25% (IQ1) | $70,481 | $87,522 |
| Interquartile 75% (IQ3) | $101,731 | $133,299 |
| Interquartile Range (IQR) | $31,250 | $45,777 |
| Standard Deviation (Sample) | $23,217 | $31,608 |
| Standard Deviation (Population) | $22,917 | $31,378 |
Similar Demographics by Householder Income Ages 25 - 44 years
Demographics Similar to Nepalese by Householder Income Ages 25 - 44 years
In terms of householder income ages 25 - 44 years, the demographic groups most similar to Nepalese are Immigrants from Cambodia ($91,533, a difference of 0.040%), Immigrants from Eastern Africa ($91,458, a difference of 0.040%), Ecuadorian ($91,574, a difference of 0.080%), Japanese ($91,624, a difference of 0.14%), and Aleut ($91,370, a difference of 0.14%).
| Demographics | Rating | Rank | Householder Income Ages 25 - 44 years |
| Spanish | 21.2 /100 | #197 | Fair $92,200 |
| Vietnamese | 20.2 /100 | #198 | Fair $92,089 |
| Kenyans | 16.8 /100 | #199 | Poor $91,684 |
| Whites/Caucasians | 16.7 /100 | #200 | Poor $91,668 |
| Japanese | 16.4 /100 | #201 | Poor $91,624 |
| Ecuadorians | 16.0 /100 | #202 | Poor $91,574 |
| Immigrants | Cambodia | 15.7 /100 | #203 | Poor $91,533 |
| Nepalese | 15.4 /100 | #204 | Poor $91,498 |
| Immigrants | Eastern Africa | 15.2 /100 | #205 | Poor $91,458 |
| Aleuts | 14.5 /100 | #206 | Poor $91,370 |
| Yugoslavians | 14.5 /100 | #207 | Poor $91,368 |
| Immigrants | Thailand | 14.3 /100 | #208 | Poor $91,337 |
| Immigrants | Uruguay | 13.2 /100 | #209 | Poor $91,171 |
| Immigrants | Kenya | 10.9 /100 | #210 | Poor $90,767 |
| Iraqis | 10.8 /100 | #211 | Poor $90,764 |
Demographics Similar to Immigrants from Belarus by Householder Income Ages 25 - 44 years
In terms of householder income ages 25 - 44 years, the demographic groups most similar to Immigrants from Belarus are Estonian ($107,269, a difference of 0.12%), Bulgarian ($107,264, a difference of 0.12%), Immigrants from Turkey ($107,258, a difference of 0.13%), Israeli ($107,579, a difference of 0.17%), and Immigrants from Indonesia ($107,627, a difference of 0.22%).
| Demographics | Rating | Rank | Householder Income Ages 25 - 44 years |
| Immigrants | France | 99.9 /100 | #39 | Exceptional $108,257 |
| Immigrants | Lithuania | 99.9 /100 | #40 | Exceptional $108,149 |
| Immigrants | Bolivia | 99.9 /100 | #41 | Exceptional $108,128 |
| Australians | 99.9 /100 | #42 | Exceptional $107,912 |
| Immigrants | Malaysia | 99.9 /100 | #43 | Exceptional $107,650 |
| Immigrants | Indonesia | 99.9 /100 | #44 | Exceptional $107,627 |
| Israelis | 99.9 /100 | #45 | Exceptional $107,579 |
| Immigrants | Belarus | 99.9 /100 | #46 | Exceptional $107,393 |
| Estonians | 99.9 /100 | #47 | Exceptional $107,269 |
| Bulgarians | 99.9 /100 | #48 | Exceptional $107,264 |
| Immigrants | Turkey | 99.9 /100 | #49 | Exceptional $107,258 |
| Cambodians | 99.9 /100 | #50 | Exceptional $107,148 |
| Immigrants | Czechoslovakia | 99.9 /100 | #51 | Exceptional $106,888 |
| Immigrants | Europe | 99.9 /100 | #52 | Exceptional $106,817 |
| Immigrants | Norway | 99.9 /100 | #53 | Exceptional $106,629 |