Immigrants from Nepal vs Immigrants from Belarus Householder Income Ages 25 - 44 years
COMPARE
Immigrants from Nepal
Immigrants from Belarus
Householder Income Ages 25 - 44 years
Householder Income Ages 25 - 44 years Comparison
Immigrants from Nepal
Immigrants from Belarus
$95,322
HOUSEHOLDER INCOME AGES 25 - 44 YEARS
60.3/ 100
METRIC RATING
165th/ 347
METRIC RANK
$107,393
HOUSEHOLDER INCOME AGES 25 - 44 YEARS
99.9/ 100
METRIC RATING
46th/ 347
METRIC RANK
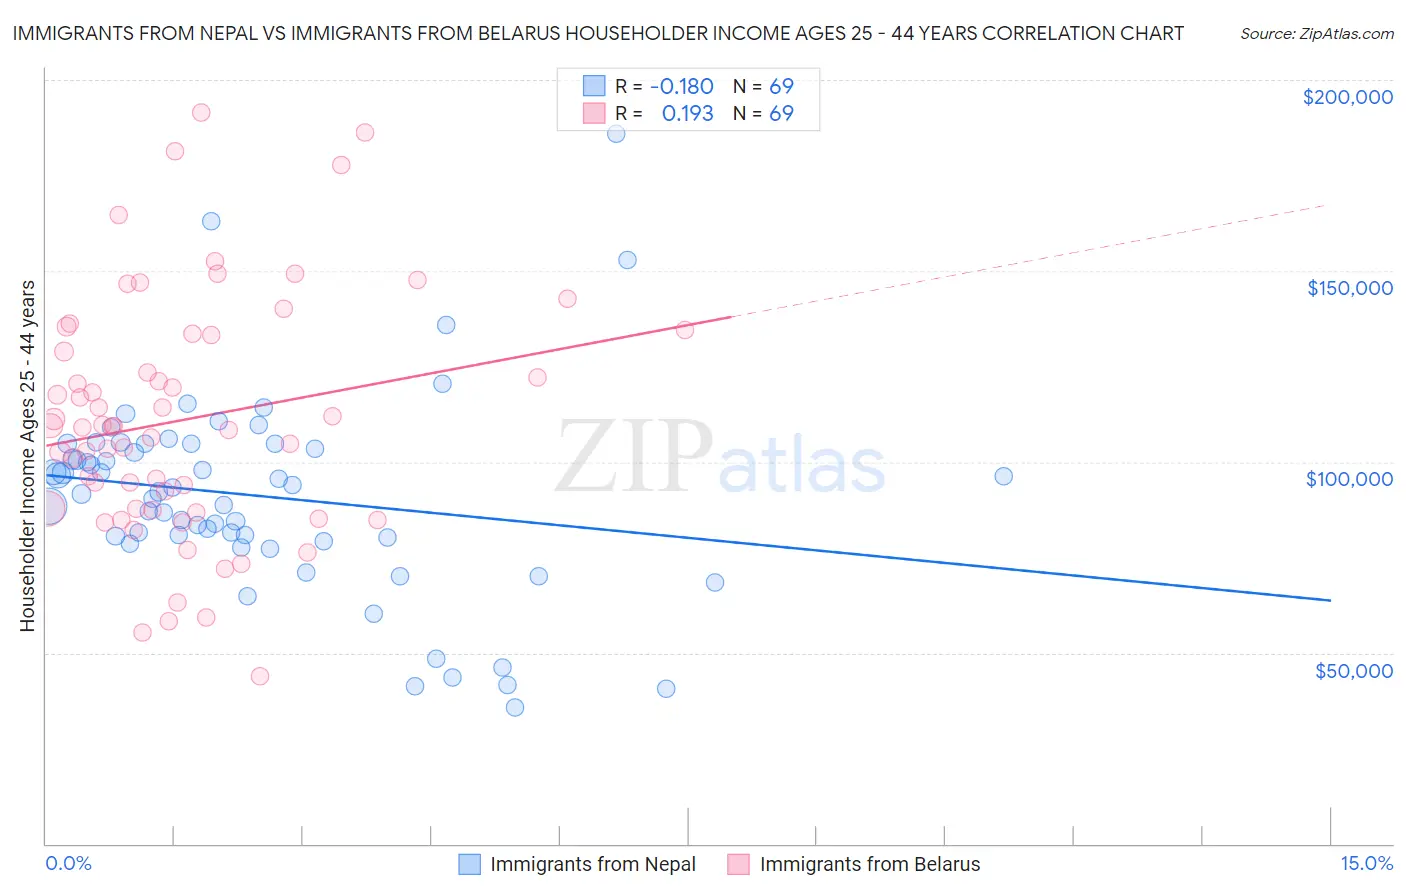
Immigrants from Nepal vs Immigrants from Belarus Householder Income Ages 25 - 44 years Correlation Chart
The statistical analysis conducted on geographies consisting of 186,599,325 people shows a poor negative correlation between the proportion of Immigrants from Nepal and household income with householder between the ages 25 and 44 in the United States with a correlation coefficient (R) of -0.180 and weighted average of $95,322. Similarly, the statistical analysis conducted on geographies consisting of 150,157,706 people shows a poor positive correlation between the proportion of Immigrants from Belarus and household income with householder between the ages 25 and 44 in the United States with a correlation coefficient (R) of 0.193 and weighted average of $107,393, a difference of 12.7%.
Householder Income Ages 25 - 44 years Correlation Summary
| Measurement | Immigrants from Nepal | Immigrants from Belarus |
| Minimum | $35,521 | $43,724 |
| Maximum | $185,946 | $191,528 |
| Range | $150,425 | $147,804 |
| Mean | $91,020 | $111,122 |
| Median | $92,147 | $109,354 |
| Interquartile 25% (IQ1) | $79,685 | $87,522 |
| Interquartile 75% (IQ3) | $104,696 | $133,299 |
| Interquartile Range (IQR) | $25,011 | $45,777 |
| Standard Deviation (Sample) | $26,432 | $31,608 |
| Standard Deviation (Population) | $26,240 | $31,378 |
Similar Demographics by Householder Income Ages 25 - 44 years
Demographics Similar to Immigrants from Nepal by Householder Income Ages 25 - 44 years
In terms of householder income ages 25 - 44 years, the demographic groups most similar to Immigrants from Nepal are South American ($95,362, a difference of 0.040%), Immigrants from Ethiopia ($95,256, a difference of 0.070%), Immigrants from Saudi Arabia ($95,450, a difference of 0.13%), Immigrants from Portugal ($95,512, a difference of 0.20%), and Swiss ($95,511, a difference of 0.20%).
| Demographics | Rating | Rank | Householder Income Ages 25 - 44 years |
| Scandinavians | 63.9 /100 | #158 | Good $95,596 |
| Costa Ricans | 63.5 /100 | #159 | Good $95,565 |
| Icelanders | 63.4 /100 | #160 | Good $95,560 |
| Immigrants | Portugal | 62.8 /100 | #161 | Good $95,512 |
| Swiss | 62.8 /100 | #162 | Good $95,511 |
| Immigrants | Saudi Arabia | 62.0 /100 | #163 | Good $95,450 |
| South Americans | 60.9 /100 | #164 | Good $95,362 |
| Immigrants | Nepal | 60.3 /100 | #165 | Good $95,322 |
| Immigrants | Ethiopia | 59.5 /100 | #166 | Average $95,256 |
| Czechoslovakians | 57.0 /100 | #167 | Average $95,070 |
| Alsatians | 56.8 /100 | #168 | Average $95,059 |
| Native Hawaiians | 56.8 /100 | #169 | Average $95,058 |
| Slovaks | 56.4 /100 | #170 | Average $95,032 |
| Immigrants | Armenia | 54.2 /100 | #171 | Average $94,867 |
| Scottish | 50.8 /100 | #172 | Average $94,622 |
Demographics Similar to Immigrants from Belarus by Householder Income Ages 25 - 44 years
In terms of householder income ages 25 - 44 years, the demographic groups most similar to Immigrants from Belarus are Estonian ($107,269, a difference of 0.12%), Bulgarian ($107,264, a difference of 0.12%), Immigrants from Turkey ($107,258, a difference of 0.13%), Israeli ($107,579, a difference of 0.17%), and Immigrants from Indonesia ($107,627, a difference of 0.22%).
| Demographics | Rating | Rank | Householder Income Ages 25 - 44 years |
| Immigrants | France | 99.9 /100 | #39 | Exceptional $108,257 |
| Immigrants | Lithuania | 99.9 /100 | #40 | Exceptional $108,149 |
| Immigrants | Bolivia | 99.9 /100 | #41 | Exceptional $108,128 |
| Australians | 99.9 /100 | #42 | Exceptional $107,912 |
| Immigrants | Malaysia | 99.9 /100 | #43 | Exceptional $107,650 |
| Immigrants | Indonesia | 99.9 /100 | #44 | Exceptional $107,627 |
| Israelis | 99.9 /100 | #45 | Exceptional $107,579 |
| Immigrants | Belarus | 99.9 /100 | #46 | Exceptional $107,393 |
| Estonians | 99.9 /100 | #47 | Exceptional $107,269 |
| Bulgarians | 99.9 /100 | #48 | Exceptional $107,264 |
| Immigrants | Turkey | 99.9 /100 | #49 | Exceptional $107,258 |
| Cambodians | 99.9 /100 | #50 | Exceptional $107,148 |
| Immigrants | Czechoslovakia | 99.9 /100 | #51 | Exceptional $106,888 |
| Immigrants | Europe | 99.9 /100 | #52 | Exceptional $106,817 |
| Immigrants | Norway | 99.9 /100 | #53 | Exceptional $106,629 |