Native Hawaiian vs Croatian Median Household Income
COMPARE
Native Hawaiian
Croatian
Median Household Income
Median Household Income Comparison
Native Hawaiians
Croatians
$89,919
MEDIAN HOUSEHOLD INCOME
95.7/ 100
METRIC RATING
116th/ 347
METRIC RANK
$90,685
MEDIAN HOUSEHOLD INCOME
97.3/ 100
METRIC RATING
107th/ 347
METRIC RANK
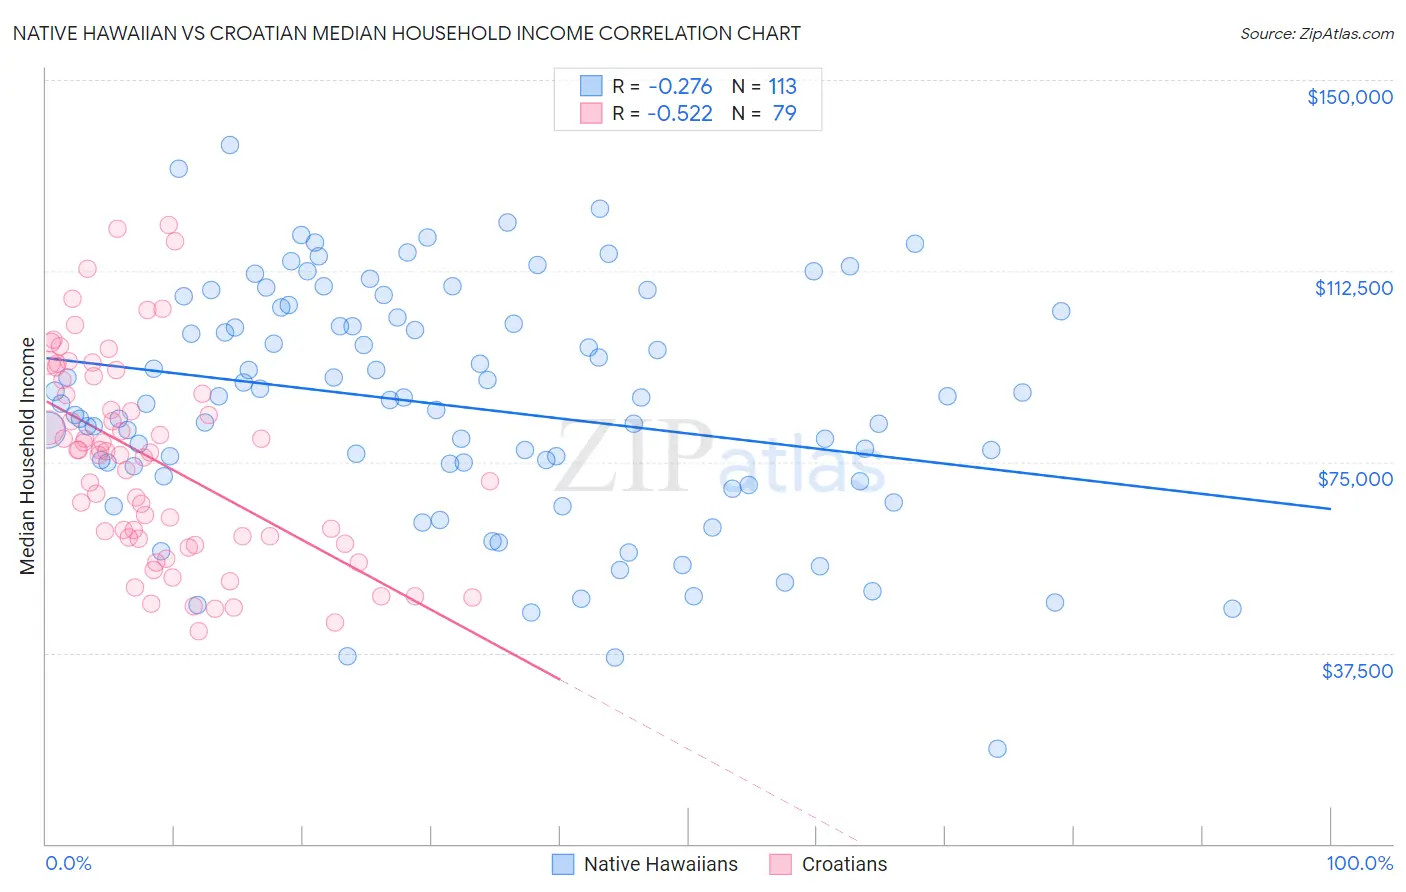
Native Hawaiian vs Croatian Median Household Income Correlation Chart
The statistical analysis conducted on geographies consisting of 331,802,706 people shows a weak negative correlation between the proportion of Native Hawaiians and median household income in the United States with a correlation coefficient (R) of -0.276 and weighted average of $89,919. Similarly, the statistical analysis conducted on geographies consisting of 375,471,157 people shows a substantial negative correlation between the proportion of Croatians and median household income in the United States with a correlation coefficient (R) of -0.522 and weighted average of $90,685, a difference of 0.85%.
Median Household Income Correlation Summary
| Measurement | Native Hawaiian | Croatian |
| Minimum | $18,739 | $41,696 |
| Maximum | $137,302 | $121,425 |
| Range | $118,563 | $79,729 |
| Mean | $86,036 | $75,345 |
| Median | $87,089 | $76,836 |
| Interquartile 25% (IQ1) | $73,233 | $59,949 |
| Interquartile 75% (IQ3) | $104,035 | $91,012 |
| Interquartile Range (IQR) | $30,802 | $31,063 |
| Standard Deviation (Sample) | $23,037 | $19,789 |
| Standard Deviation (Population) | $22,935 | $19,663 |
Demographics Similar to Native Hawaiians and Croatians by Median Household Income
In terms of median household income, the demographic groups most similar to Native Hawaiians are Taiwanese ($89,900, a difference of 0.020%), Immigrants from Western Asia ($90,005, a difference of 0.10%), Syrian ($89,830, a difference of 0.10%), Immigrants from Northern Africa ($90,026, a difference of 0.12%), and Albanian ($89,744, a difference of 0.20%). Similarly, the demographic groups most similar to Croatians are Zimbabwean ($90,618, a difference of 0.070%), Macedonian ($90,761, a difference of 0.080%), Chilean ($90,605, a difference of 0.090%), Palestinian ($90,574, a difference of 0.12%), and Immigrants from Poland ($90,549, a difference of 0.15%).
| Demographics | Rating | Rank | Median Household Income |
| Immigrants | Moldova | 98.3 /100 | #101 | Exceptional $91,446 |
| Austrians | 98.2 /100 | #102 | Exceptional $91,339 |
| Immigrants | Ukraine | 98.0 /100 | #103 | Exceptional $91,124 |
| Immigrants | Kazakhstan | 97.8 /100 | #104 | Exceptional $91,015 |
| Immigrants | Brazil | 97.7 /100 | #105 | Exceptional $90,907 |
| Macedonians | 97.4 /100 | #106 | Exceptional $90,761 |
| Croatians | 97.3 /100 | #107 | Exceptional $90,685 |
| Zimbabweans | 97.2 /100 | #108 | Exceptional $90,618 |
| Chileans | 97.2 /100 | #109 | Exceptional $90,605 |
| Palestinians | 97.1 /100 | #110 | Exceptional $90,574 |
| Immigrants | Poland | 97.1 /100 | #111 | Exceptional $90,549 |
| Northern Europeans | 96.9 /100 | #112 | Exceptional $90,446 |
| Peruvians | 96.5 /100 | #113 | Exceptional $90,261 |
| Immigrants | Northern Africa | 95.9 /100 | #114 | Exceptional $90,026 |
| Immigrants | Western Asia | 95.9 /100 | #115 | Exceptional $90,005 |
| Native Hawaiians | 95.7 /100 | #116 | Exceptional $89,919 |
| Taiwanese | 95.6 /100 | #117 | Exceptional $89,900 |
| Syrians | 95.4 /100 | #118 | Exceptional $89,830 |
| Albanians | 95.2 /100 | #119 | Exceptional $89,744 |
| Immigrants | North Macedonia | 95.2 /100 | #120 | Exceptional $89,741 |
| Ethiopians | 94.9 /100 | #121 | Exceptional $89,640 |