Iroquois vs Croatian Median Household Income
COMPARE
Iroquois
Croatian
Median Household Income
Median Household Income Comparison
Iroquois
Croatians
$74,279
MEDIAN HOUSEHOLD INCOME
0.1/ 100
METRIC RATING
287th/ 347
METRIC RANK
$90,685
MEDIAN HOUSEHOLD INCOME
97.3/ 100
METRIC RATING
107th/ 347
METRIC RANK
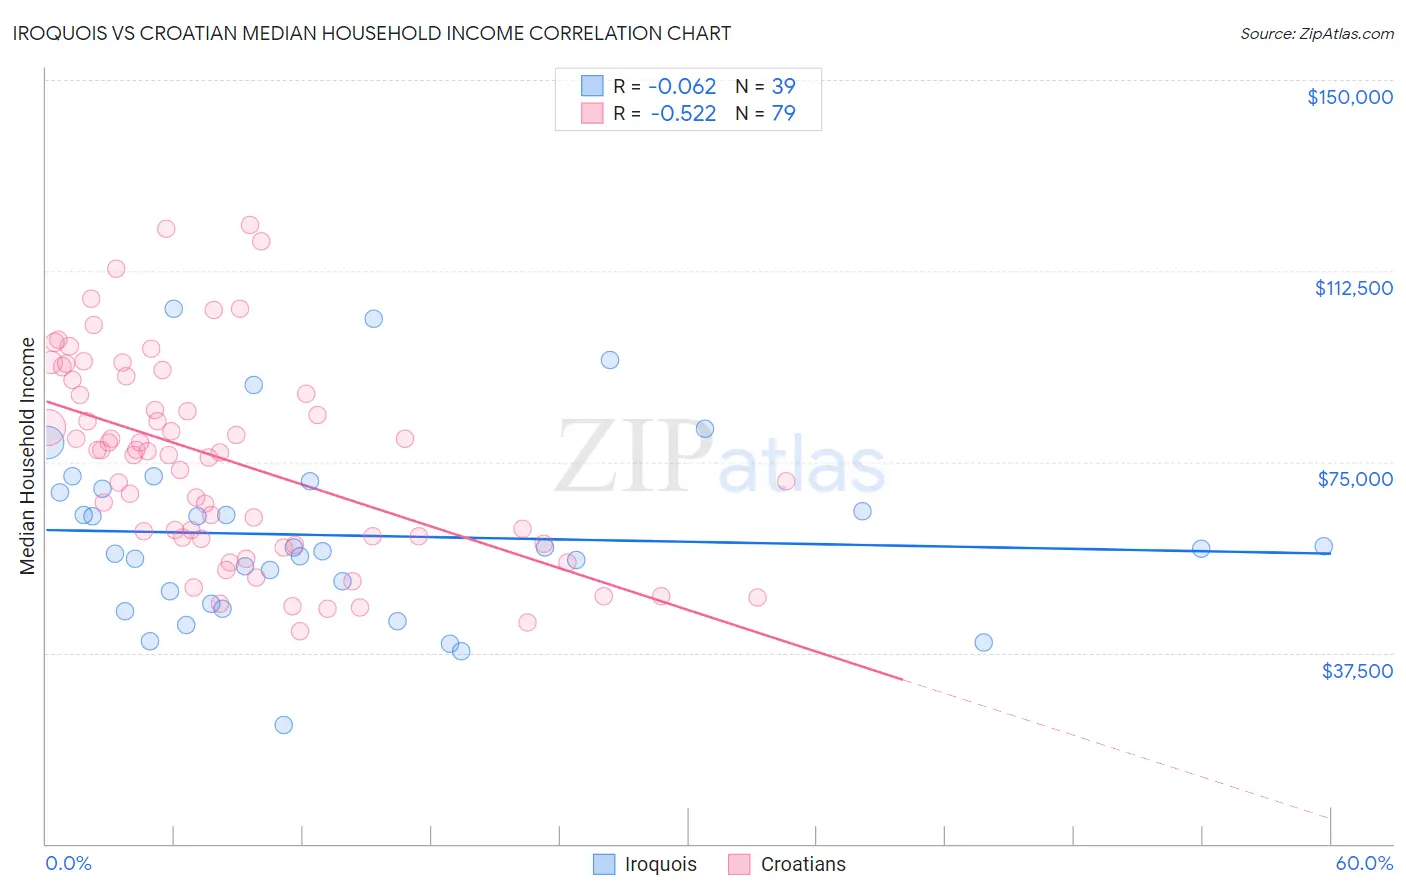
Iroquois vs Croatian Median Household Income Correlation Chart
The statistical analysis conducted on geographies consisting of 207,210,720 people shows a slight negative correlation between the proportion of Iroquois and median household income in the United States with a correlation coefficient (R) of -0.062 and weighted average of $74,279. Similarly, the statistical analysis conducted on geographies consisting of 375,471,157 people shows a substantial negative correlation between the proportion of Croatians and median household income in the United States with a correlation coefficient (R) of -0.522 and weighted average of $90,685, a difference of 22.1%.
Median Household Income Correlation Summary
| Measurement | Iroquois | Croatian |
| Minimum | $23,438 | $41,696 |
| Maximum | $105,077 | $121,425 |
| Range | $81,639 | $79,729 |
| Mean | $60,531 | $75,345 |
| Median | $57,969 | $76,836 |
| Interquartile 25% (IQ1) | $47,045 | $59,949 |
| Interquartile 75% (IQ3) | $69,753 | $91,012 |
| Interquartile Range (IQR) | $22,708 | $31,063 |
| Standard Deviation (Sample) | $17,808 | $19,789 |
| Standard Deviation (Population) | $17,578 | $19,663 |
Similar Demographics by Median Household Income
Demographics Similar to Iroquois by Median Household Income
In terms of median household income, the demographic groups most similar to Iroquois are Immigrants from Somalia ($74,300, a difference of 0.030%), Immigrants from Central America ($74,217, a difference of 0.080%), Fijian ($74,205, a difference of 0.10%), Mexican ($74,399, a difference of 0.16%), and Bangladeshi ($74,112, a difference of 0.23%).
| Demographics | Rating | Rank | Median Household Income |
| Senegalese | 0.2 /100 | #280 | Tragic $74,999 |
| Immigrants | Liberia | 0.1 /100 | #281 | Tragic $74,896 |
| Central American Indians | 0.1 /100 | #282 | Tragic $74,847 |
| Cree | 0.1 /100 | #283 | Tragic $74,685 |
| Yaqui | 0.1 /100 | #284 | Tragic $74,596 |
| Mexicans | 0.1 /100 | #285 | Tragic $74,399 |
| Immigrants | Somalia | 0.1 /100 | #286 | Tragic $74,300 |
| Iroquois | 0.1 /100 | #287 | Tragic $74,279 |
| Immigrants | Central America | 0.1 /100 | #288 | Tragic $74,217 |
| Fijians | 0.1 /100 | #289 | Tragic $74,205 |
| Bangladeshis | 0.1 /100 | #290 | Tragic $74,112 |
| Hispanics or Latinos | 0.1 /100 | #291 | Tragic $73,823 |
| Comanche | 0.1 /100 | #292 | Tragic $73,747 |
| Immigrants | Cabo Verde | 0.1 /100 | #293 | Tragic $73,515 |
| Blackfeet | 0.1 /100 | #294 | Tragic $73,509 |
Demographics Similar to Croatians by Median Household Income
In terms of median household income, the demographic groups most similar to Croatians are Zimbabwean ($90,618, a difference of 0.070%), Macedonian ($90,761, a difference of 0.080%), Chilean ($90,605, a difference of 0.090%), Palestinian ($90,574, a difference of 0.12%), and Immigrants from Poland ($90,549, a difference of 0.15%).
| Demographics | Rating | Rank | Median Household Income |
| Ukrainians | 98.3 /100 | #100 | Exceptional $91,456 |
| Immigrants | Moldova | 98.3 /100 | #101 | Exceptional $91,446 |
| Austrians | 98.2 /100 | #102 | Exceptional $91,339 |
| Immigrants | Ukraine | 98.0 /100 | #103 | Exceptional $91,124 |
| Immigrants | Kazakhstan | 97.8 /100 | #104 | Exceptional $91,015 |
| Immigrants | Brazil | 97.7 /100 | #105 | Exceptional $90,907 |
| Macedonians | 97.4 /100 | #106 | Exceptional $90,761 |
| Croatians | 97.3 /100 | #107 | Exceptional $90,685 |
| Zimbabweans | 97.2 /100 | #108 | Exceptional $90,618 |
| Chileans | 97.2 /100 | #109 | Exceptional $90,605 |
| Palestinians | 97.1 /100 | #110 | Exceptional $90,574 |
| Immigrants | Poland | 97.1 /100 | #111 | Exceptional $90,549 |
| Northern Europeans | 96.9 /100 | #112 | Exceptional $90,446 |
| Peruvians | 96.5 /100 | #113 | Exceptional $90,261 |
| Immigrants | Northern Africa | 95.9 /100 | #114 | Exceptional $90,026 |