Moroccan vs Immigrants from Venezuela Median Household Income
COMPARE
Moroccan
Immigrants from Venezuela
Median Household Income
Median Household Income Comparison
Moroccans
Immigrants from Venezuela
$86,468
MEDIAN HOUSEHOLD INCOME
70.6/ 100
METRIC RATING
158th/ 347
METRIC RANK
$81,506
MEDIAN HOUSEHOLD INCOME
9.0/ 100
METRIC RATING
220th/ 347
METRIC RANK
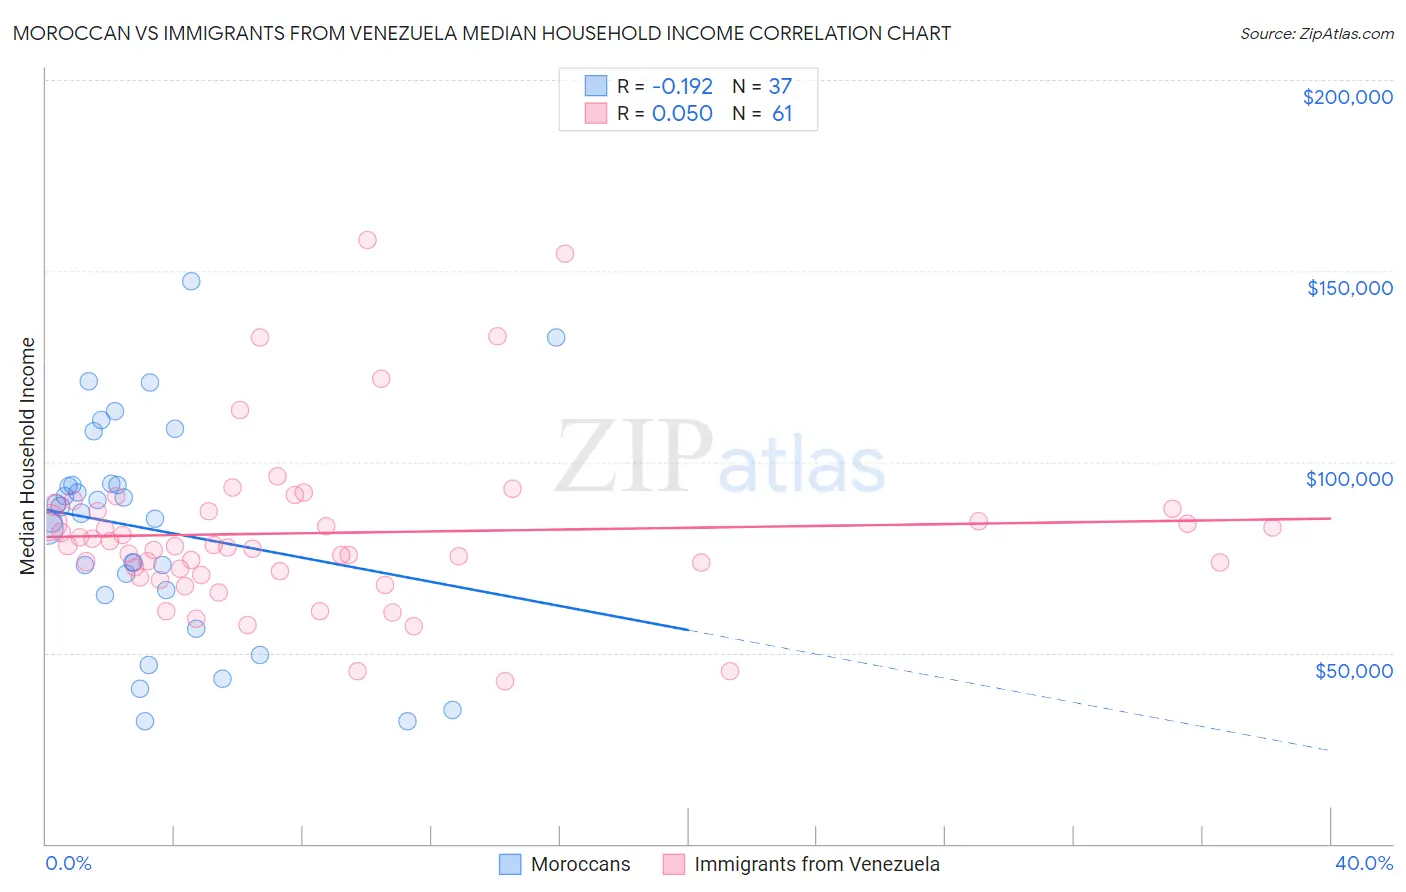
Moroccan vs Immigrants from Venezuela Median Household Income Correlation Chart
The statistical analysis conducted on geographies consisting of 201,723,300 people shows a poor negative correlation between the proportion of Moroccans and median household income in the United States with a correlation coefficient (R) of -0.192 and weighted average of $86,468. Similarly, the statistical analysis conducted on geographies consisting of 287,748,058 people shows a slight positive correlation between the proportion of Immigrants from Venezuela and median household income in the United States with a correlation coefficient (R) of 0.050 and weighted average of $81,506, a difference of 6.1%.
Median Household Income Correlation Summary
| Measurement | Moroccan | Immigrants from Venezuela |
| Minimum | $32,040 | $42,664 |
| Maximum | $147,408 | $158,184 |
| Range | $115,368 | $115,520 |
| Mean | $82,404 | $81,402 |
| Median | $86,580 | $77,762 |
| Interquartile 25% (IQ1) | $65,781 | $70,867 |
| Interquartile 75% (IQ3) | $94,096 | $87,517 |
| Interquartile Range (IQR) | $28,314 | $16,650 |
| Standard Deviation (Sample) | $28,098 | $22,039 |
| Standard Deviation (Population) | $27,716 | $21,858 |
Similar Demographics by Median Household Income
Demographics Similar to Moroccans by Median Household Income
In terms of median household income, the demographic groups most similar to Moroccans are Samoan ($86,498, a difference of 0.040%), Immigrants from Uzbekistan ($86,425, a difference of 0.050%), Luxembourger ($86,418, a difference of 0.060%), Immigrants from Albania ($86,534, a difference of 0.080%), and Slavic ($86,398, a difference of 0.080%).
| Demographics | Rating | Rank | Median Household Income |
| Hungarians | 76.3 /100 | #151 | Good $86,920 |
| Immigrants | Saudi Arabia | 75.8 /100 | #152 | Good $86,875 |
| South Americans | 75.1 /100 | #153 | Good $86,824 |
| Immigrants | Germany | 74.4 /100 | #154 | Good $86,764 |
| Carpatho Rusyns | 72.8 /100 | #155 | Good $86,635 |
| Immigrants | Albania | 71.5 /100 | #156 | Good $86,534 |
| Samoans | 71.0 /100 | #157 | Good $86,498 |
| Moroccans | 70.6 /100 | #158 | Good $86,468 |
| Immigrants | Uzbekistan | 70.1 /100 | #159 | Good $86,425 |
| Luxembourgers | 70.0 /100 | #160 | Good $86,418 |
| Slavs | 69.7 /100 | #161 | Good $86,398 |
| Guamanians/Chamorros | 67.7 /100 | #162 | Good $86,255 |
| Czechs | 66.4 /100 | #163 | Good $86,164 |
| Irish | 66.2 /100 | #164 | Good $86,145 |
| Norwegians | 65.3 /100 | #165 | Good $86,084 |
Demographics Similar to Immigrants from Venezuela by Median Household Income
In terms of median household income, the demographic groups most similar to Immigrants from Venezuela are Immigrants from Ghana ($81,489, a difference of 0.020%), Nigerian ($81,725, a difference of 0.27%), Immigrants from Nigeria ($81,236, a difference of 0.33%), Immigrants from El Salvador ($81,213, a difference of 0.36%), and Malaysian ($81,064, a difference of 0.54%).
| Demographics | Rating | Rank | Median Household Income |
| Nepalese | 15.1 /100 | #213 | Poor $82,410 |
| Panamanians | 14.0 /100 | #214 | Poor $82,272 |
| Vietnamese | 13.8 /100 | #215 | Poor $82,248 |
| Yugoslavians | 13.3 /100 | #216 | Poor $82,186 |
| Ecuadorians | 12.5 /100 | #217 | Poor $82,070 |
| Whites/Caucasians | 12.2 /100 | #218 | Poor $82,029 |
| Nigerians | 10.3 /100 | #219 | Poor $81,725 |
| Immigrants | Venezuela | 9.0 /100 | #220 | Tragic $81,506 |
| Immigrants | Ghana | 9.0 /100 | #221 | Tragic $81,489 |
| Immigrants | Nigeria | 7.7 /100 | #222 | Tragic $81,236 |
| Immigrants | El Salvador | 7.6 /100 | #223 | Tragic $81,213 |
| Malaysians | 7.0 /100 | #224 | Tragic $81,064 |
| Scotch-Irish | 6.6 /100 | #225 | Tragic $80,972 |
| Immigrants | Panama | 6.2 /100 | #226 | Tragic $80,873 |
| Guyanese | 5.7 /100 | #227 | Tragic $80,734 |