Moroccan vs Immigrants from Spain Median Household Income
COMPARE
Moroccan
Immigrants from Spain
Median Household Income
Median Household Income Comparison
Moroccans
Immigrants from Spain
$86,468
MEDIAN HOUSEHOLD INCOME
70.6/ 100
METRIC RATING
158th/ 347
METRIC RANK
$92,732
MEDIAN HOUSEHOLD INCOME
99.3/ 100
METRIC RATING
82nd/ 347
METRIC RANK
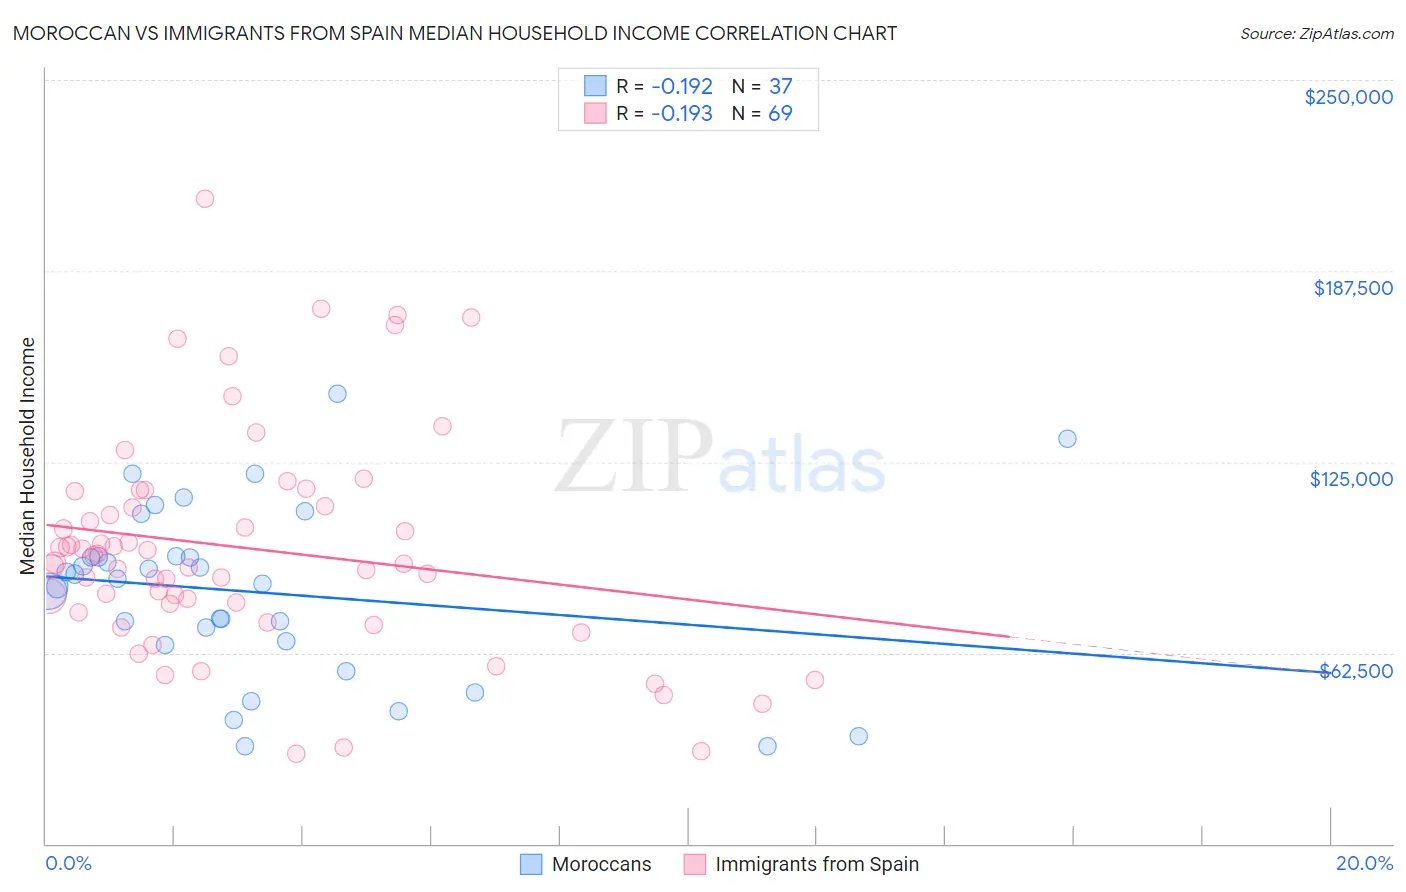
Moroccan vs Immigrants from Spain Median Household Income Correlation Chart
The statistical analysis conducted on geographies consisting of 201,723,300 people shows a poor negative correlation between the proportion of Moroccans and median household income in the United States with a correlation coefficient (R) of -0.192 and weighted average of $86,468. Similarly, the statistical analysis conducted on geographies consisting of 239,554,501 people shows a poor negative correlation between the proportion of Immigrants from Spain and median household income in the United States with a correlation coefficient (R) of -0.193 and weighted average of $92,732, a difference of 7.2%.
Median Household Income Correlation Summary
| Measurement | Moroccan | Immigrants from Spain |
| Minimum | $32,040 | $29,291 |
| Maximum | $147,408 | $211,250 |
| Range | $115,368 | $181,959 |
| Mean | $82,404 | $96,765 |
| Median | $86,580 | $92,124 |
| Interquartile 25% (IQ1) | $65,781 | $77,194 |
| Interquartile 75% (IQ3) | $94,096 | $112,999 |
| Interquartile Range (IQR) | $28,314 | $35,805 |
| Standard Deviation (Sample) | $28,098 | $36,186 |
| Standard Deviation (Population) | $27,716 | $35,922 |
Similar Demographics by Median Household Income
Demographics Similar to Moroccans by Median Household Income
In terms of median household income, the demographic groups most similar to Moroccans are Samoan ($86,498, a difference of 0.040%), Immigrants from Uzbekistan ($86,425, a difference of 0.050%), Luxembourger ($86,418, a difference of 0.060%), Immigrants from Albania ($86,534, a difference of 0.080%), and Slavic ($86,398, a difference of 0.080%).
| Demographics | Rating | Rank | Median Household Income |
| Hungarians | 76.3 /100 | #151 | Good $86,920 |
| Immigrants | Saudi Arabia | 75.8 /100 | #152 | Good $86,875 |
| South Americans | 75.1 /100 | #153 | Good $86,824 |
| Immigrants | Germany | 74.4 /100 | #154 | Good $86,764 |
| Carpatho Rusyns | 72.8 /100 | #155 | Good $86,635 |
| Immigrants | Albania | 71.5 /100 | #156 | Good $86,534 |
| Samoans | 71.0 /100 | #157 | Good $86,498 |
| Moroccans | 70.6 /100 | #158 | Good $86,468 |
| Immigrants | Uzbekistan | 70.1 /100 | #159 | Good $86,425 |
| Luxembourgers | 70.0 /100 | #160 | Good $86,418 |
| Slavs | 69.7 /100 | #161 | Good $86,398 |
| Guamanians/Chamorros | 67.7 /100 | #162 | Good $86,255 |
| Czechs | 66.4 /100 | #163 | Good $86,164 |
| Irish | 66.2 /100 | #164 | Good $86,145 |
| Norwegians | 65.3 /100 | #165 | Good $86,084 |
Demographics Similar to Immigrants from Spain by Median Household Income
In terms of median household income, the demographic groups most similar to Immigrants from Spain are Italian ($92,475, a difference of 0.28%), Immigrants from Eastern Europe ($93,051, a difference of 0.34%), Immigrants from Argentina ($92,417, a difference of 0.34%), Tongan ($93,076, a difference of 0.37%), and Sri Lankan ($93,093, a difference of 0.39%).
| Demographics | Rating | Rank | Median Household Income |
| Immigrants | Italy | 99.5 /100 | #75 | Exceptional $93,465 |
| South Africans | 99.5 /100 | #76 | Exceptional $93,379 |
| Immigrants | Afghanistan | 99.5 /100 | #77 | Exceptional $93,375 |
| Immigrants | Bulgaria | 99.4 /100 | #78 | Exceptional $93,148 |
| Sri Lankans | 99.4 /100 | #79 | Exceptional $93,093 |
| Tongans | 99.4 /100 | #80 | Exceptional $93,076 |
| Immigrants | Eastern Europe | 99.4 /100 | #81 | Exceptional $93,051 |
| Immigrants | Spain | 99.3 /100 | #82 | Exceptional $92,732 |
| Italians | 99.1 /100 | #83 | Exceptional $92,475 |
| Immigrants | Argentina | 99.1 /100 | #84 | Exceptional $92,417 |
| Immigrants | Croatia | 99.0 /100 | #85 | Exceptional $92,225 |
| Immigrants | England | 98.9 /100 | #86 | Exceptional $92,098 |
| Immigrants | Hungary | 98.9 /100 | #87 | Exceptional $92,094 |
| Immigrants | Canada | 98.8 /100 | #88 | Exceptional $92,029 |
| Romanians | 98.8 /100 | #89 | Exceptional $91,994 |