Moroccan vs Bulgarian Householder Income Ages 25 - 44 years

COMPARE

Moroccan
Race
Ancestry
AfghanAfricanAlaska NativeAlaskan AthabascanAlbanianAleutAlsatianAmericanApacheArabArapahoArgentineanArmenianAssyrian/Chaldean/SyriacAustralianAustrianBahamianBangladeshiBarbadianBasqueBelgianBelizeanBermudanBhutaneseBlackfeetBolivianBrazilianBritishBritish West IndianBurmeseCajunCambodianCanadianCape VerdeanCarpatho RusynCelticCentral AmericanCentral American IndianCherokeeCheyenneChickasawChileanChineseChippewaChoctawColombianColvilleComancheCosta RicanCreeCreekCroatianCrowCubanCypriotCzechCzechoslovakianDanishDelawareDominicanDutchDutch West IndianEastern EuropeanEcuadorianEgyptianEnglishEstonianEthiopianEuropeanFijianFilipinoFinnishFrenchFrench American IndianFrench CanadianGermanGerman RussianGhanaianGreekGuamanian/ChamorroGuatemalanGuyaneseHaitianHmongHonduranHopiHoumaHungarianIcelanderIndian (Asian)IndonesianInupiatIranianIraqiIrishIroquoisIsraeliItalianJamaicanJapaneseJordanianKenyanKiowaKoreanLaotianLatvianLebaneseLiberianLithuanianLumbeeLuxembourgerMacedonianMalaysianMalteseMarshalleseMenomineeMexicanMexican American IndianMongolianMoroccanNative HawaiianNavajoNepaleseNew ZealanderNicaraguanNigerianNorthern EuropeanNorwegianOkinawanOsageOttawaPaiutePakistaniPalestinianPanamanianParaguayanPennsylvania GermanPeruvianPimaPolishPortuguesePotawatomiPuebloPuerto RicanPuget Sound SalishRomanianRussianSalvadoranSamoanScandinavianScotch-IrishScottishSeminoleSenegaleseSerbianShoshoneSierra LeoneanSiouxSlavicSlovakSloveneSomaliSouth AfricanSouth AmericanSouth American IndianSoviet UnionSpaniardSpanishSpanish AmericanSpanish American IndianSri LankanSubsaharan AfricanSudaneseSwedishSwissSyrianTaiwaneseThaiTlingit-HaidaTohono O'OdhamTonganTrinidadian and TobagonianTsimshianTurkishU.S. Virgin IslanderUgandanUkrainianUruguayanUteVenezuelanVietnameseWelshWest IndianYakamaYaquiYugoslavianYumanYup'ikZimbabwean
Immigration
NonimmigrantsImmigrantsAfghanistanAfricaAlbaniaArgentinaArmeniaAsiaAustraliaAustriaBahamasBangladeshBarbadosBelarusBelgiumBelizeBoliviaBosnia and HerzegovinaBrazilBulgariaBurma/MyanmarCabo VerdeCambodiaCameroonCanadaCaribbeanCentral AmericaChileChinaColombiaCongoCosta RicaCroatiaCubaCzechoslovakiaDenmarkDominicaDominican RepublicEastern AfricaEastern AsiaEastern EuropeEcuadorEgyptEl SalvadorEnglandEritreaEthiopiaEuropeFijiFranceGermanyGhanaGreeceGrenadaGuatemalaGuyanaHaitiHondurasHong KongHungaryIndiaIndonesiaIranIraqIrelandIsraelItalyJamaicaJapanJordanKazakhstanKenyaKoreaKuwaitLaosLatin AmericaLatviaLebanonLiberiaLithuaniaMalaysiaMexicoMicronesiaMiddle AfricaMoldovaMoroccoNepalNetherlandsNicaraguaNigeriaNorth AmericaNorth MacedoniaNorthern AfricaNorthern EuropeNorwayOceaniaPakistanPanamaPeruPhilippinesPolandPortugalRomaniaRussiaSaudi ArabiaScotlandSenegalSerbiaSierra LeoneSingaporeSomaliaSouth AfricaSouth AmericaSouth Central AsiaSouth Eastern AsiaSouthern EuropeSpainSri LankaSt. Vincent and the GrenadinesSudanSwedenSwitzerlandSyriaTaiwanThailandTrinidad and TobagoTurkeyUgandaUkraineUruguayUzbekistanVenezuelaVietnamWest IndiesWestern AfricaWestern AsiaWestern EuropeYemenZaireZimbabweAzores
Bulgarian
Race
Ancestry
AfghanAfricanAlaska NativeAlaskan AthabascanAlbanianAleutAlsatianAmericanApacheArabArapahoArgentineanArmenianAssyrian/Chaldean/SyriacAustralianAustrianBahamianBangladeshiBarbadianBasqueBelgianBelizeanBermudanBhutaneseBlackfeetBolivianBrazilianBritishBritish West IndianBulgarianBurmeseCajunCambodianCanadianCape VerdeanCarpatho RusynCelticCentral AmericanCentral American IndianCherokeeCheyenneChickasawChileanChineseChippewaChoctawColombianColvilleComancheCosta RicanCreeCreekCroatianCrowCubanCypriotCzechCzechoslovakianDanishDelawareDominicanDutchDutch West IndianEastern EuropeanEcuadorianEgyptianEnglishEstonianEthiopianEuropeanFijianFilipinoFinnishFrenchFrench American IndianFrench CanadianGermanGerman RussianGhanaianGreekGuamanian/ChamorroGuatemalanGuyaneseHaitianHmongHonduranHopiHoumaHungarianIcelanderIndian (Asian)IndonesianInupiatIranianIraqiIrishIroquoisIsraeliItalianJamaicanJapaneseJordanianKenyanKiowaKoreanLaotianLatvianLebaneseLiberianLithuanianLumbeeLuxembourgerMacedonianMalaysianMalteseMarshalleseMenomineeMexicanMexican American IndianMongolianNative HawaiianNavajoNepaleseNew ZealanderNicaraguanNigerianNorthern EuropeanNorwegianOkinawanOsageOttawaPaiutePakistaniPalestinianPanamanianParaguayanPennsylvania GermanPeruvianPimaPolishPortuguesePotawatomiPuebloPuerto RicanPuget Sound SalishRomanianRussianSalvadoranSamoanScandinavianScotch-IrishScottishSeminoleSenegaleseSerbianShoshoneSierra LeoneanSiouxSlavicSlovakSloveneSomaliSouth AfricanSouth AmericanSouth American IndianSoviet UnionSpaniardSpanishSpanish AmericanSpanish American IndianSri LankanSubsaharan AfricanSudaneseSwedishSwissSyrianTaiwaneseThaiTlingit-HaidaTohono O'OdhamTonganTrinidadian and TobagonianTsimshianTurkishU.S. Virgin IslanderUgandanUkrainianUruguayanUteVenezuelanVietnameseWelshWest IndianYakamaYaquiYugoslavianYumanYup'ikZimbabwean
Immigration
NonimmigrantsImmigrantsAfghanistanAfricaAlbaniaArgentinaArmeniaAsiaAustraliaAustriaBahamasBangladeshBarbadosBelarusBelgiumBelizeBoliviaBosnia and HerzegovinaBrazilBulgariaBurma/MyanmarCabo VerdeCambodiaCameroonCanadaCaribbeanCentral AmericaChileChinaColombiaCongoCosta RicaCroatiaCubaCzechoslovakiaDenmarkDominicaDominican RepublicEastern AfricaEastern AsiaEastern EuropeEcuadorEgyptEl SalvadorEnglandEritreaEthiopiaEuropeFijiFranceGermanyGhanaGreeceGrenadaGuatemalaGuyanaHaitiHondurasHong KongHungaryIndiaIndonesiaIranIraqIrelandIsraelItalyJamaicaJapanJordanKazakhstanKenyaKoreaKuwaitLaosLatin AmericaLatviaLebanonLiberiaLithuaniaMalaysiaMexicoMicronesiaMiddle AfricaMoldovaMoroccoNepalNetherlandsNicaraguaNigeriaNorth AmericaNorth MacedoniaNorthern AfricaNorthern EuropeNorwayOceaniaPakistanPanamaPeruPhilippinesPolandPortugalRomaniaRussiaSaudi ArabiaScotlandSenegalSerbiaSierra LeoneSingaporeSomaliaSouth AfricaSouth AmericaSouth Central AsiaSouth Eastern AsiaSouthern EuropeSpainSri LankaSt. Vincent and the GrenadinesSudanSwedenSwitzerlandSyriaTaiwanThailandTrinidad and TobagoTurkeyUgandaUkraineUruguayUzbekistanVenezuelaVietnamWest IndiesWestern AfricaWestern AsiaWestern EuropeYemenZaireZimbabweAzores
Householder Income Ages 25 - 44 years
Income
Poverty
Unemployment
Labor Participation
Family Structure
Vehicle Availability
Education Level
Disability

Householder Income Ages 25 - 44 years Comparison

Moroccans

Bulgarians

Good
Exceptional
$96,117
HOUSEHOLDER INCOME AGES 25 - 44 YEARS
70.3/ 100
METRIC RATING
155th/ 347
METRIC RANK
$107,264
HOUSEHOLDER INCOME AGES 25 - 44 YEARS
99.9/ 100
METRIC RATING
48th/ 347
METRIC RANK

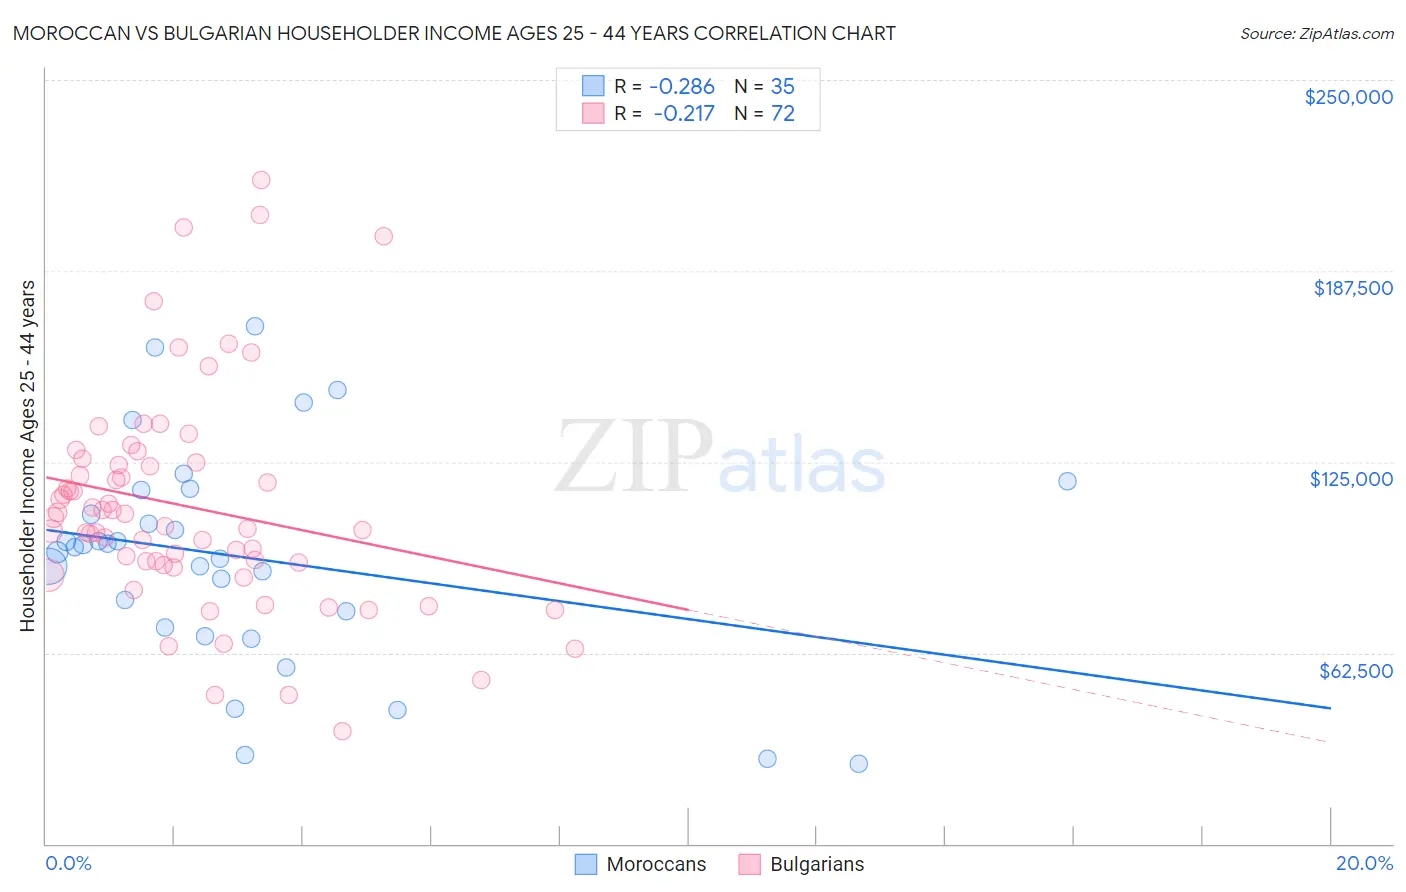
Moroccan vs Bulgarian Householder Income Ages 25 - 44 years Correlation Chart

The statistical analysis conducted on geographies consisting of 201,535,372 people shows a weak negative correlation between the proportion of Moroccans and household income with householder between the ages 25 and 44 in the United States with a correlation coefficient (R) of -0.286 and weighted average of $96,117. Similarly, the statistical analysis conducted on geographies consisting of 205,263,192 people shows a weak negative correlation between the proportion of Bulgarians and household income with householder between the ages 25 and 44 in the United States with a correlation coefficient (R) of -0.217 and weighted average of $107,264, a difference of 11.6%.
Moroccan vs Bulgarian Householder Income Ages 25 - 44 years

Householder Income Ages 25 - 44 years Correlation Summary

MeasurementMoroccanBulgarian
Minimum$26,250$36,944
Maximum$169,563$217,083
Range$143,313$180,139
Mean$93,636$110,338
Median$96,963$105,369
Interquartile 25% (IQ1)$70,962$91,534
Interquartile 75% (IQ3)$115,732$124,530
Interquartile Range (IQR)$44,770$32,997
Standard Deviation (Sample)$35,487$35,831
Standard Deviation (Population)$34,976$35,581

Similar Demographics by Householder Income Ages 25 - 44 years

Demographics Similar to Moroccans by Householder Income Ages 25 - 44 years

In terms of householder income ages 25 - 44 years, the demographic groups most similar to Moroccans are Immigrants from Germany ($95,913, a difference of 0.21%), Slavic ($96,377, a difference of 0.27%), Slovene ($96,439, a difference of 0.33%), South American Indian ($96,497, a difference of 0.40%), and Czech ($96,525, a difference of 0.42%).
DemographicsRating | RankHouseholder Income Ages 25 - 44 years
Irish
76.9
/100
|
#148
Good
$96,730
Basques
76.6
/100
|
#149
Good
$96,709
Ugandans
76.2
/100
|
#150
Good
$96,667
Czechs
74.8
/100
|
#151
Good
$96,525
South American Indians
74.5
/100
|
#152
Good
$96,497
Slovenes
73.9
/100
|
#153
Good
$96,439
Slavs
73.2
/100
|
#154
Good
$96,377
Moroccans
70.3
/100
|
#155
Good
$96,117
Immigrants | Germany
67.9
/100
|
#156
Good
$95,913
Immigrants | Uganda
65.2
/100
|
#157
Good
$95,698
Scandinavians
63.9
/100
|
#158
Good
$95,596
Costa Ricans
63.5
/100
|
#159
Good
$95,565
Icelanders
63.4
/100
|
#160
Good
$95,560
Immigrants | Portugal
62.8
/100
|
#161
Good
$95,512
Swiss
62.8
/100
|
#162
Good
$95,511

Demographics Similar to Bulgarians by Householder Income Ages 25 - 44 years

In terms of householder income ages 25 - 44 years, the demographic groups most similar to Bulgarians are Estonian ($107,269, a difference of 0.010%), Immigrants from Turkey ($107,258, a difference of 0.010%), Cambodian ($107,148, a difference of 0.11%), Immigrants from Belarus ($107,393, a difference of 0.12%), and Israeli ($107,579, a difference of 0.29%).
DemographicsRating | RankHouseholder Income Ages 25 - 44 years
Immigrants | Bolivia
99.9
/100
|
#41
Exceptional
$108,128
Australians
99.9
/100
|
#42
Exceptional
$107,912
Immigrants | Malaysia
99.9
/100
|
#43
Exceptional
$107,650
Immigrants | Indonesia
99.9
/100
|
#44
Exceptional
$107,627
Israelis
99.9
/100
|
#45
Exceptional
$107,579
Immigrants | Belarus
99.9
/100
|
#46
Exceptional
$107,393
Estonians
99.9
/100
|
#47
Exceptional
$107,269
Bulgarians
99.9
/100
|
#48
Exceptional
$107,264
Immigrants | Turkey
99.9
/100
|
#49
Exceptional
$107,258
Cambodians
99.9
/100
|
#50
Exceptional
$107,148
Immigrants | Czechoslovakia
99.9
/100
|
#51
Exceptional
$106,888
Immigrants | Europe
99.9
/100
|
#52
Exceptional
$106,817
Immigrants | Norway
99.9
/100
|
#53
Exceptional
$106,629
Paraguayans
99.9
/100
|
#54
Exceptional
$106,615
Greeks
99.9
/100
|
#55
Exceptional
$106,457