Immigrants from Cameroon vs Bulgarian Householder Income Ages 25 - 44 years

COMPARE

Immigrants from Cameroon
Race
Ancestry
AfghanAfricanAlaska NativeAlaskan AthabascanAlbanianAleutAlsatianAmericanApacheArabArapahoArgentineanArmenianAssyrian/Chaldean/SyriacAustralianAustrianBahamianBangladeshiBarbadianBasqueBelgianBelizeanBermudanBhutaneseBlackfeetBolivianBrazilianBritishBritish West IndianBurmeseCajunCambodianCanadianCape VerdeanCarpatho RusynCelticCentral AmericanCentral American IndianCherokeeCheyenneChickasawChileanChineseChippewaChoctawColombianColvilleComancheCosta RicanCreeCreekCroatianCrowCubanCypriotCzechCzechoslovakianDanishDelawareDominicanDutchDutch West IndianEastern EuropeanEcuadorianEgyptianEnglishEstonianEthiopianEuropeanFijianFilipinoFinnishFrenchFrench American IndianFrench CanadianGermanGerman RussianGhanaianGreekGuamanian/ChamorroGuatemalanGuyaneseHaitianHmongHonduranHopiHoumaHungarianIcelanderIndian (Asian)IndonesianInupiatIranianIraqiIrishIroquoisIsraeliItalianJamaicanJapaneseJordanianKenyanKiowaKoreanLaotianLatvianLebaneseLiberianLithuanianLumbeeLuxembourgerMacedonianMalaysianMalteseMarshalleseMenomineeMexicanMexican American IndianMongolianMoroccanNative HawaiianNavajoNepaleseNew ZealanderNicaraguanNigerianNorthern EuropeanNorwegianOkinawanOsageOttawaPaiutePakistaniPalestinianPanamanianParaguayanPennsylvania GermanPeruvianPimaPolishPortuguesePotawatomiPuebloPuerto RicanPuget Sound SalishRomanianRussianSalvadoranSamoanScandinavianScotch-IrishScottishSeminoleSenegaleseSerbianShoshoneSierra LeoneanSiouxSlavicSlovakSloveneSomaliSouth AfricanSouth AmericanSouth American IndianSoviet UnionSpaniardSpanishSpanish AmericanSpanish American IndianSri LankanSubsaharan AfricanSudaneseSwedishSwissSyrianTaiwaneseThaiTlingit-HaidaTohono O'OdhamTonganTrinidadian and TobagonianTsimshianTurkishU.S. Virgin IslanderUgandanUkrainianUruguayanUteVenezuelanVietnameseWelshWest IndianYakamaYaquiYugoslavianYumanYup'ikZimbabwean
Immigration
NonimmigrantsImmigrantsAfghanistanAfricaAlbaniaArgentinaArmeniaAsiaAustraliaAustriaBahamasBangladeshBarbadosBelarusBelgiumBelizeBoliviaBosnia and HerzegovinaBrazilBulgariaBurma/MyanmarCabo VerdeCambodiaCameroonCanadaCaribbeanCentral AmericaChileChinaColombiaCongoCosta RicaCroatiaCubaCzechoslovakiaDenmarkDominicaDominican RepublicEastern AfricaEastern AsiaEastern EuropeEcuadorEgyptEl SalvadorEnglandEritreaEthiopiaEuropeFijiFranceGermanyGhanaGreeceGrenadaGuatemalaGuyanaHaitiHondurasHong KongHungaryIndiaIndonesiaIranIraqIrelandIsraelItalyJamaicaJapanJordanKazakhstanKenyaKoreaKuwaitLaosLatin AmericaLatviaLebanonLiberiaLithuaniaMalaysiaMexicoMicronesiaMiddle AfricaMoldovaMoroccoNepalNetherlandsNicaraguaNigeriaNorth AmericaNorth MacedoniaNorthern AfricaNorthern EuropeNorwayOceaniaPakistanPanamaPeruPhilippinesPolandPortugalRomaniaRussiaSaudi ArabiaScotlandSenegalSerbiaSierra LeoneSingaporeSomaliaSouth AfricaSouth AmericaSouth Central AsiaSouth Eastern AsiaSouthern EuropeSpainSri LankaSt. Vincent and the GrenadinesSudanSwedenSwitzerlandSyriaTaiwanThailandTrinidad and TobagoTurkeyUgandaUkraineUruguayUzbekistanVenezuelaVietnamWest IndiesWestern AfricaWestern AsiaWestern EuropeYemenZaireZimbabweAzores
Bulgarian
Race
Ancestry
AfghanAfricanAlaska NativeAlaskan AthabascanAlbanianAleutAlsatianAmericanApacheArabArapahoArgentineanArmenianAssyrian/Chaldean/SyriacAustralianAustrianBahamianBangladeshiBarbadianBasqueBelgianBelizeanBermudanBhutaneseBlackfeetBolivianBrazilianBritishBritish West IndianBulgarianBurmeseCajunCambodianCanadianCape VerdeanCarpatho RusynCelticCentral AmericanCentral American IndianCherokeeCheyenneChickasawChileanChineseChippewaChoctawColombianColvilleComancheCosta RicanCreeCreekCroatianCrowCubanCypriotCzechCzechoslovakianDanishDelawareDominicanDutchDutch West IndianEastern EuropeanEcuadorianEgyptianEnglishEstonianEthiopianEuropeanFijianFilipinoFinnishFrenchFrench American IndianFrench CanadianGermanGerman RussianGhanaianGreekGuamanian/ChamorroGuatemalanGuyaneseHaitianHmongHonduranHopiHoumaHungarianIcelanderIndian (Asian)IndonesianInupiatIranianIraqiIrishIroquoisIsraeliItalianJamaicanJapaneseJordanianKenyanKiowaKoreanLaotianLatvianLebaneseLiberianLithuanianLumbeeLuxembourgerMacedonianMalaysianMalteseMarshalleseMenomineeMexicanMexican American IndianMongolianMoroccanNative HawaiianNavajoNepaleseNew ZealanderNicaraguanNigerianNorthern EuropeanNorwegianOkinawanOsageOttawaPaiutePakistaniPalestinianPanamanianParaguayanPennsylvania GermanPeruvianPimaPolishPortuguesePotawatomiPuebloPuerto RicanPuget Sound SalishRomanianRussianSalvadoranSamoanScandinavianScotch-IrishScottishSeminoleSenegaleseSerbianShoshoneSierra LeoneanSiouxSlavicSlovakSloveneSomaliSouth AfricanSouth AmericanSouth American IndianSoviet UnionSpaniardSpanishSpanish AmericanSpanish American IndianSri LankanSubsaharan AfricanSudaneseSwedishSwissSyrianTaiwaneseThaiTlingit-HaidaTohono O'OdhamTonganTrinidadian and TobagonianTsimshianTurkishU.S. Virgin IslanderUgandanUkrainianUruguayanUteVenezuelanVietnameseWelshWest IndianYakamaYaquiYugoslavianYumanYup'ikZimbabwean
Immigration
NonimmigrantsImmigrantsAfghanistanAfricaAlbaniaArgentinaArmeniaAsiaAustraliaAustriaBahamasBangladeshBarbadosBelarusBelgiumBelizeBoliviaBosnia and HerzegovinaBrazilBulgariaBurma/MyanmarCabo VerdeCambodiaCanadaCaribbeanCentral AmericaChileChinaColombiaCongoCosta RicaCroatiaCubaCzechoslovakiaDenmarkDominicaDominican RepublicEastern AfricaEastern AsiaEastern EuropeEcuadorEgyptEl SalvadorEnglandEritreaEthiopiaEuropeFijiFranceGermanyGhanaGreeceGrenadaGuatemalaGuyanaHaitiHondurasHong KongHungaryIndiaIndonesiaIranIraqIrelandIsraelItalyJamaicaJapanJordanKazakhstanKenyaKoreaKuwaitLaosLatin AmericaLatviaLebanonLiberiaLithuaniaMalaysiaMexicoMicronesiaMiddle AfricaMoldovaMoroccoNepalNetherlandsNicaraguaNigeriaNorth AmericaNorth MacedoniaNorthern AfricaNorthern EuropeNorwayOceaniaPakistanPanamaPeruPhilippinesPolandPortugalRomaniaRussiaSaudi ArabiaScotlandSenegalSerbiaSierra LeoneSingaporeSomaliaSouth AfricaSouth AmericaSouth Central AsiaSouth Eastern AsiaSouthern EuropeSpainSri LankaSt. Vincent and the GrenadinesSudanSwedenSwitzerlandSyriaTaiwanThailandTrinidad and TobagoTurkeyUgandaUkraineUruguayUzbekistanVenezuelaVietnamWest IndiesWestern AfricaWestern AsiaWestern EuropeYemenZaireZimbabweAzores
Householder Income Ages 25 - 44 years
Income
Poverty
Unemployment
Labor Participation
Family Structure
Vehicle Availability
Education Level
Disability

Householder Income Ages 25 - 44 years Comparison

Immigrants from Cameroon

Bulgarians

Tragic
Exceptional
$88,214
HOUSEHOLDER INCOME AGES 25 - 44 YEARS
2.9/ 100
METRIC RATING
236th/ 347
METRIC RANK
$107,264
HOUSEHOLDER INCOME AGES 25 - 44 YEARS
99.9/ 100
METRIC RATING
48th/ 347
METRIC RANK

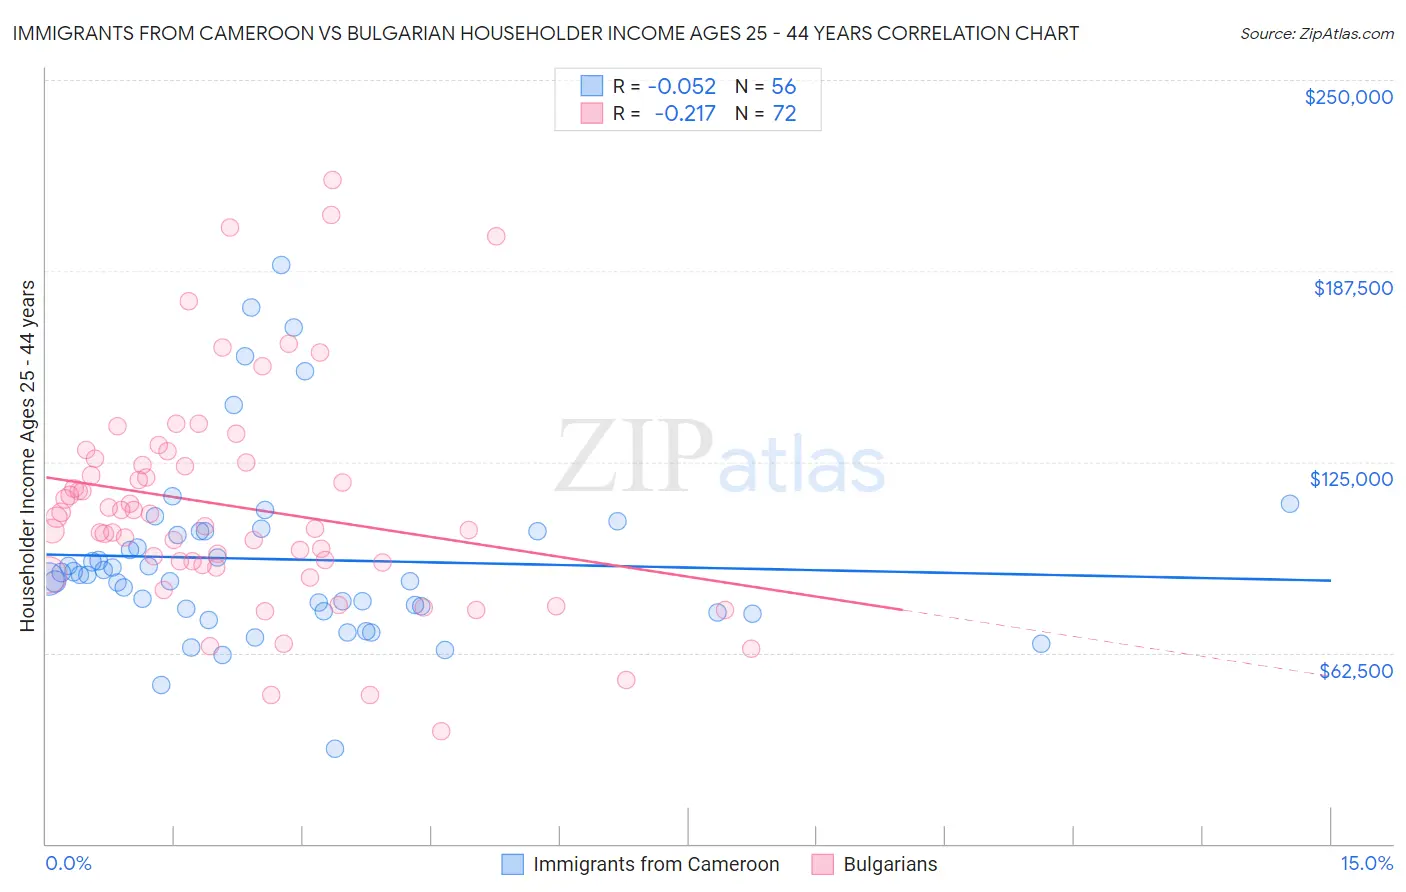
Immigrants from Cameroon vs Bulgarian Householder Income Ages 25 - 44 years Correlation Chart

The statistical analysis conducted on geographies consisting of 130,701,481 people shows a slight negative correlation between the proportion of Immigrants from Cameroon and household income with householder between the ages 25 and 44 in the United States with a correlation coefficient (R) of -0.052 and weighted average of $88,214. Similarly, the statistical analysis conducted on geographies consisting of 205,263,192 people shows a weak negative correlation between the proportion of Bulgarians and household income with householder between the ages 25 and 44 in the United States with a correlation coefficient (R) of -0.217 and weighted average of $107,264, a difference of 21.6%.
Immigrants from Cameroon vs Bulgarian Householder Income Ages 25 - 44 years

Householder Income Ages 25 - 44 years Correlation Summary

MeasurementImmigrants from CameroonBulgarian
Minimum$31,250$36,944
Maximum$189,447$217,083
Range$158,197$180,139
Mean$93,103$110,338
Median$88,029$105,369
Interquartile 25% (IQ1)$76,496$91,534
Interquartile 75% (IQ3)$102,206$124,530
Interquartile Range (IQR)$25,711$32,997
Standard Deviation (Sample)$29,847$35,831
Standard Deviation (Population)$29,580$35,581

Similar Demographics by Householder Income Ages 25 - 44 years

Demographics Similar to Immigrants from Cameroon by Householder Income Ages 25 - 44 years

In terms of householder income ages 25 - 44 years, the demographic groups most similar to Immigrants from Cameroon are Venezuelan ($88,232, a difference of 0.020%), Bermudan ($88,231, a difference of 0.020%), Salvadoran ($88,198, a difference of 0.020%), Malaysian ($88,291, a difference of 0.090%), and Nonimmigrants ($88,301, a difference of 0.10%).
DemographicsRating | RankHouseholder Income Ages 25 - 44 years
Immigrants | Barbados
3.7
/100
|
#229
Tragic
$88,687
Alaskan Athabascans
3.3
/100
|
#230
Tragic
$88,446
Immigrants | Grenada
3.0
/100
|
#231
Tragic
$88,311
Immigrants | Nonimmigrants
3.0
/100
|
#232
Tragic
$88,301
Malaysians
3.0
/100
|
#233
Tragic
$88,291
Venezuelans
2.9
/100
|
#234
Tragic
$88,232
Bermudans
2.9
/100
|
#235
Tragic
$88,231
Immigrants | Cameroon
2.9
/100
|
#236
Tragic
$88,214
Salvadorans
2.8
/100
|
#237
Tragic
$88,198
Alaska Natives
2.6
/100
|
#238
Tragic
$88,018
Immigrants | Ghana
2.2
/100
|
#239
Tragic
$87,760
Nicaraguans
2.2
/100
|
#240
Tragic
$87,751
Nigerians
2.2
/100
|
#241
Tragic
$87,730
West Indians
1.7
/100
|
#242
Tragic
$87,205
Immigrants | West Indies
1.5
/100
|
#243
Tragic
$87,063

Demographics Similar to Bulgarians by Householder Income Ages 25 - 44 years

In terms of householder income ages 25 - 44 years, the demographic groups most similar to Bulgarians are Estonian ($107,269, a difference of 0.010%), Immigrants from Turkey ($107,258, a difference of 0.010%), Cambodian ($107,148, a difference of 0.11%), Immigrants from Belarus ($107,393, a difference of 0.12%), and Israeli ($107,579, a difference of 0.29%).
DemographicsRating | RankHouseholder Income Ages 25 - 44 years
Immigrants | Bolivia
99.9
/100
|
#41
Exceptional
$108,128
Australians
99.9
/100
|
#42
Exceptional
$107,912
Immigrants | Malaysia
99.9
/100
|
#43
Exceptional
$107,650
Immigrants | Indonesia
99.9
/100
|
#44
Exceptional
$107,627
Israelis
99.9
/100
|
#45
Exceptional
$107,579
Immigrants | Belarus
99.9
/100
|
#46
Exceptional
$107,393
Estonians
99.9
/100
|
#47
Exceptional
$107,269
Bulgarians
99.9
/100
|
#48
Exceptional
$107,264
Immigrants | Turkey
99.9
/100
|
#49
Exceptional
$107,258
Cambodians
99.9
/100
|
#50
Exceptional
$107,148
Immigrants | Czechoslovakia
99.9
/100
|
#51
Exceptional
$106,888
Immigrants | Europe
99.9
/100
|
#52
Exceptional
$106,817
Immigrants | Norway
99.9
/100
|
#53
Exceptional
$106,629
Paraguayans
99.9
/100
|
#54
Exceptional
$106,615
Greeks
99.9
/100
|
#55
Exceptional
$106,457