Mongolian vs Czech Householder Income Under 25 years
COMPARE
Mongolian
Czech
Householder Income Under 25 years
Householder Income Under 25 years Comparison
Mongolians
Czechs
$52,540
HOUSEHOLDER INCOME UNDER 25 YEARS
70.2/ 100
METRIC RATING
159th/ 347
METRIC RANK
$51,421
HOUSEHOLDER INCOME UNDER 25 YEARS
13.2/ 100
METRIC RATING
204th/ 347
METRIC RANK
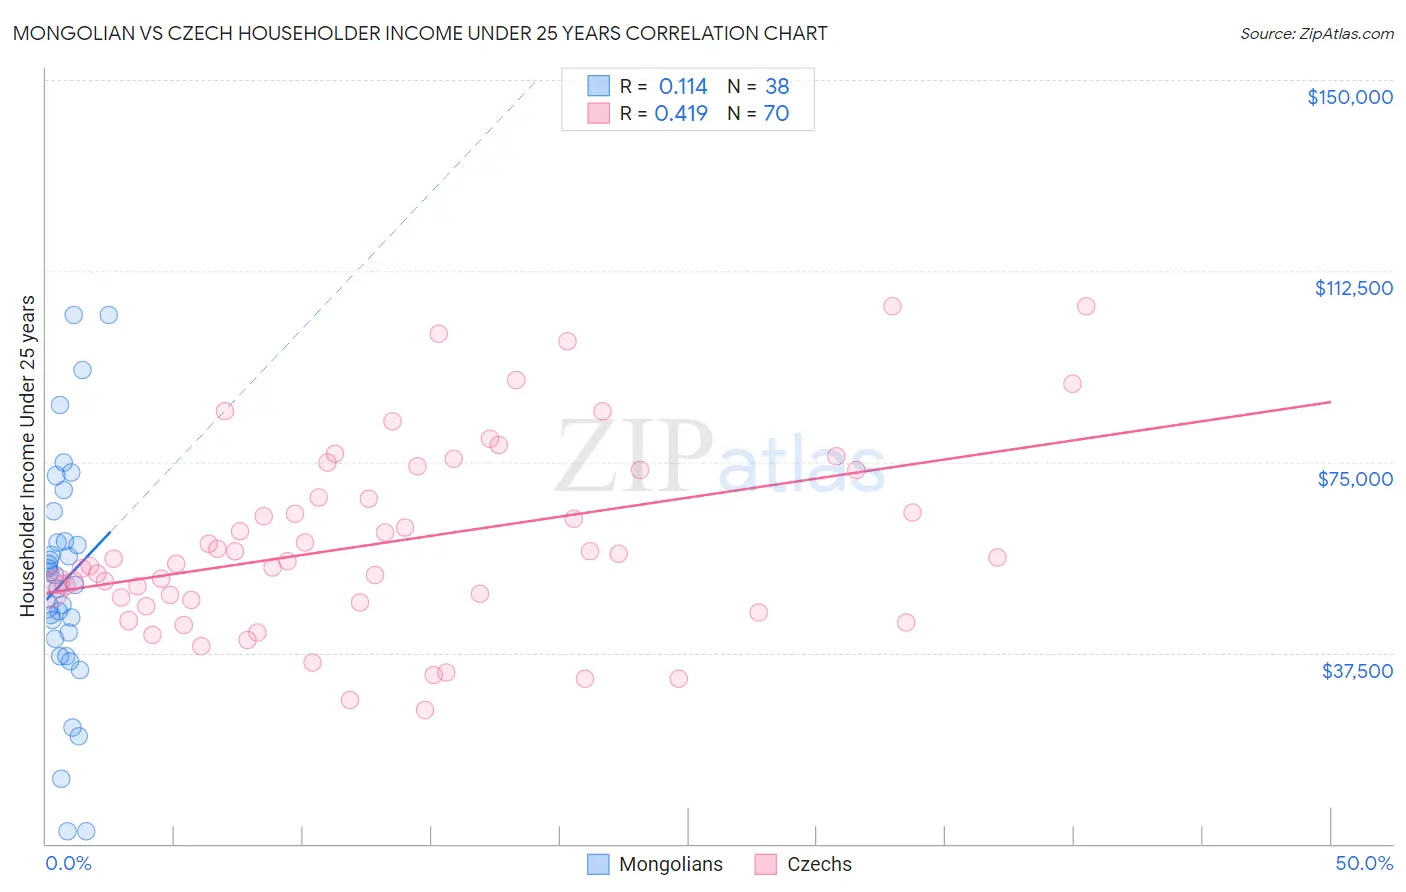
Mongolian vs Czech Householder Income Under 25 years Correlation Chart
The statistical analysis conducted on geographies consisting of 130,351,633 people shows a poor positive correlation between the proportion of Mongolians and household income with householder under the age of 25 in the United States with a correlation coefficient (R) of 0.114 and weighted average of $52,540. Similarly, the statistical analysis conducted on geographies consisting of 392,855,658 people shows a moderate positive correlation between the proportion of Czechs and household income with householder under the age of 25 in the United States with a correlation coefficient (R) of 0.419 and weighted average of $51,421, a difference of 2.2%.
Householder Income Under 25 years Correlation Summary
| Measurement | Mongolian | Czech |
| Minimum | $2,499 | $26,250 |
| Maximum | $103,839 | $105,500 |
| Range | $101,340 | $79,250 |
| Mean | $51,654 | $59,266 |
| Median | $51,754 | $55,643 |
| Interquartile 25% (IQ1) | $40,145 | $47,952 |
| Interquartile 75% (IQ3) | $59,299 | $73,438 |
| Interquartile Range (IQR) | $19,154 | $25,486 |
| Standard Deviation (Sample) | $23,318 | $18,394 |
| Standard Deviation (Population) | $23,009 | $18,262 |
Similar Demographics by Householder Income Under 25 years
Demographics Similar to Mongolians by Householder Income Under 25 years
In terms of householder income under 25 years, the demographic groups most similar to Mongolians are Immigrants from Turkey ($52,503, a difference of 0.070%), Ghanaian ($52,594, a difference of 0.10%), Immigrants from Netherlands ($52,592, a difference of 0.10%), Immigrants from Nepal ($52,611, a difference of 0.13%), and Immigrants from Denmark ($52,612, a difference of 0.14%).
| Demographics | Rating | Rank | Householder Income Under 25 years |
| Trinidadians and Tobagonians | 74.6 /100 | #152 | Good $52,631 |
| Central Americans | 74.4 /100 | #153 | Good $52,626 |
| Immigrants | Azores | 74.2 /100 | #154 | Good $52,621 |
| Immigrants | Denmark | 73.8 /100 | #155 | Good $52,612 |
| Immigrants | Nepal | 73.7 /100 | #156 | Good $52,611 |
| Ghanaians | 72.9 /100 | #157 | Good $52,594 |
| Immigrants | Netherlands | 72.8 /100 | #158 | Good $52,592 |
| Mongolians | 70.2 /100 | #159 | Good $52,540 |
| Immigrants | Turkey | 68.3 /100 | #160 | Good $52,503 |
| Uruguayans | 66.2 /100 | #161 | Good $52,465 |
| Immigrants | Cambodia | 65.4 /100 | #162 | Good $52,450 |
| Immigrants | Chile | 64.8 /100 | #163 | Good $52,440 |
| Immigrants | Trinidad and Tobago | 64.7 /100 | #164 | Good $52,437 |
| Poles | 63.0 /100 | #165 | Good $52,407 |
| Immigrants | Austria | 62.6 /100 | #166 | Good $52,400 |
Demographics Similar to Czechs by Householder Income Under 25 years
In terms of householder income under 25 years, the demographic groups most similar to Czechs are Immigrants from Cameroon ($51,433, a difference of 0.020%), Immigrants from Guatemala ($51,447, a difference of 0.050%), Cape Verdean ($51,387, a difference of 0.070%), Immigrants from Latin America ($51,387, a difference of 0.070%), and South African ($51,383, a difference of 0.070%).
| Demographics | Rating | Rank | Householder Income Under 25 years |
| Pima | 15.7 /100 | #197 | Poor $51,503 |
| Immigrants | Syria | 15.4 /100 | #198 | Poor $51,494 |
| Swiss | 15.4 /100 | #199 | Poor $51,493 |
| Immigrants | West Indies | 14.9 /100 | #200 | Poor $51,479 |
| British | 14.9 /100 | #201 | Poor $51,477 |
| Immigrants | Guatemala | 14.0 /100 | #202 | Poor $51,447 |
| Immigrants | Cameroon | 13.6 /100 | #203 | Poor $51,433 |
| Czechs | 13.2 /100 | #204 | Poor $51,421 |
| Cape Verdeans | 12.3 /100 | #205 | Poor $51,387 |
| Immigrants | Latin America | 12.3 /100 | #206 | Poor $51,387 |
| South Africans | 12.2 /100 | #207 | Poor $51,383 |
| Immigrants | Jordan | 11.9 /100 | #208 | Poor $51,370 |
| Syrians | 11.4 /100 | #209 | Poor $51,353 |
| Immigrants | Ghana | 10.9 /100 | #210 | Poor $51,333 |
| Irish | 10.6 /100 | #211 | Poor $51,317 |