Mexican vs Immigrants from Zaire Median Male Earnings
COMPARE
Mexican
Immigrants from Zaire
Median Male Earnings
Median Male Earnings Comparison
Mexicans
Immigrants from Zaire
$46,147
MEDIAN MALE EARNINGS
0.0/ 100
METRIC RATING
317th/ 347
METRIC RANK
$47,070
MEDIAN MALE EARNINGS
0.1/ 100
METRIC RATING
299th/ 347
METRIC RANK
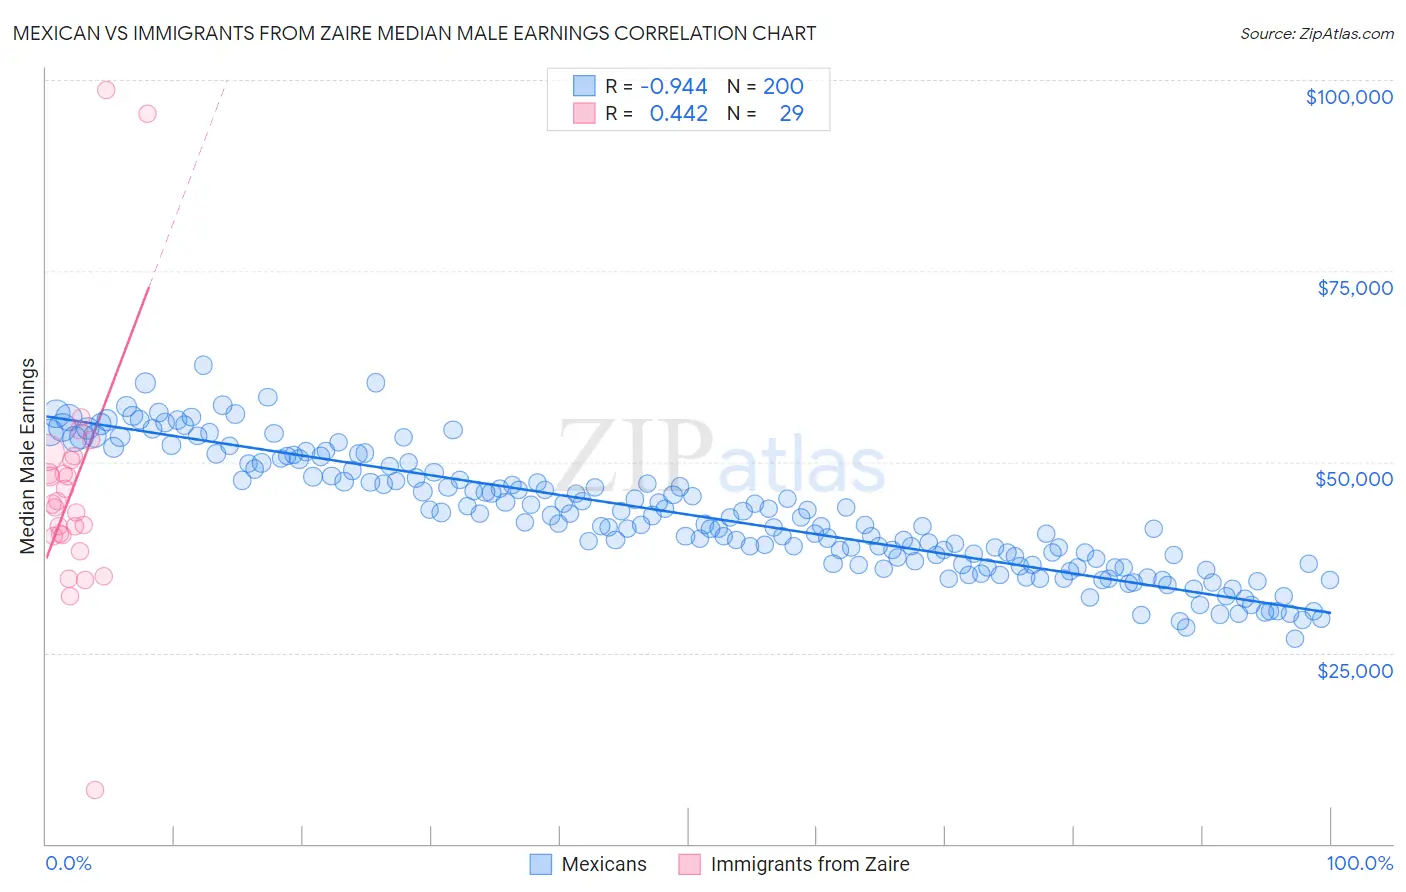
Mexican vs Immigrants from Zaire Median Male Earnings Correlation Chart
The statistical analysis conducted on geographies consisting of 564,183,218 people shows a near-perfect negative correlation between the proportion of Mexicans and median male earnings in the United States with a correlation coefficient (R) of -0.944 and weighted average of $46,147. Similarly, the statistical analysis conducted on geographies consisting of 107,252,506 people shows a moderate positive correlation between the proportion of Immigrants from Zaire and median male earnings in the United States with a correlation coefficient (R) of 0.442 and weighted average of $47,070, a difference of 2.0%.
Median Male Earnings Correlation Summary
| Measurement | Mexican | Immigrants from Zaire |
| Minimum | $26,771 | $7,065 |
| Maximum | $62,671 | $98,750 |
| Range | $35,900 | $91,685 |
| Mean | $43,079 | $46,699 |
| Median | $42,356 | $44,438 |
| Interquartile 25% (IQ1) | $36,668 | $40,386 |
| Interquartile 75% (IQ3) | $48,978 | $50,511 |
| Interquartile Range (IQR) | $12,309 | $10,125 |
| Standard Deviation (Sample) | $7,897 | $16,725 |
| Standard Deviation (Population) | $7,878 | $16,434 |
Demographics Similar to Mexicans and Immigrants from Zaire by Median Male Earnings
In terms of median male earnings, the demographic groups most similar to Mexicans are Immigrants from Caribbean ($46,193, a difference of 0.10%), Cheyenne ($46,062, a difference of 0.18%), Immigrants from Guatemala ($46,244, a difference of 0.21%), Chippewa ($46,368, a difference of 0.48%), and Honduran ($46,374, a difference of 0.49%). Similarly, the demographic groups most similar to Immigrants from Zaire are U.S. Virgin Islander ($47,066, a difference of 0.010%), Immigrants from Micronesia ($47,177, a difference of 0.23%), Immigrants from Latin America ($46,941, a difference of 0.28%), Seminole ($46,783, a difference of 0.61%), and Yaqui ($46,777, a difference of 0.63%).
| Demographics | Rating | Rank | Median Male Earnings |
| Immigrants | Micronesia | 0.1 /100 | #298 | Tragic $47,177 |
| Immigrants | Zaire | 0.1 /100 | #299 | Tragic $47,070 |
| U.S. Virgin Islanders | 0.1 /100 | #300 | Tragic $47,066 |
| Immigrants | Latin America | 0.1 /100 | #301 | Tragic $46,941 |
| Seminole | 0.1 /100 | #302 | Tragic $46,783 |
| Yaqui | 0.1 /100 | #303 | Tragic $46,777 |
| Bangladeshis | 0.1 /100 | #304 | Tragic $46,744 |
| Guatemalans | 0.0 /100 | #305 | Tragic $46,736 |
| Dutch West Indians | 0.0 /100 | #306 | Tragic $46,656 |
| Immigrants | Dominican Republic | 0.0 /100 | #307 | Tragic $46,655 |
| Ottawa | 0.0 /100 | #308 | Tragic $46,611 |
| Creek | 0.0 /100 | #309 | Tragic $46,594 |
| Cubans | 0.0 /100 | #310 | Tragic $46,580 |
| Apache | 0.0 /100 | #311 | Tragic $46,429 |
| Hispanics or Latinos | 0.0 /100 | #312 | Tragic $46,419 |
| Hondurans | 0.0 /100 | #313 | Tragic $46,374 |
| Chippewa | 0.0 /100 | #314 | Tragic $46,368 |
| Immigrants | Guatemala | 0.0 /100 | #315 | Tragic $46,244 |
| Immigrants | Caribbean | 0.0 /100 | #316 | Tragic $46,193 |
| Mexicans | 0.0 /100 | #317 | Tragic $46,147 |
| Cheyenne | 0.0 /100 | #318 | Tragic $46,062 |