Marshallese vs Immigrants from Zaire Median Male Earnings
COMPARE
Marshallese
Immigrants from Zaire
Median Male Earnings
Median Male Earnings Comparison
Marshallese
Immigrants from Zaire
$48,137
MEDIAN MALE EARNINGS
0.2/ 100
METRIC RATING
281st/ 347
METRIC RANK
$47,070
MEDIAN MALE EARNINGS
0.1/ 100
METRIC RATING
299th/ 347
METRIC RANK
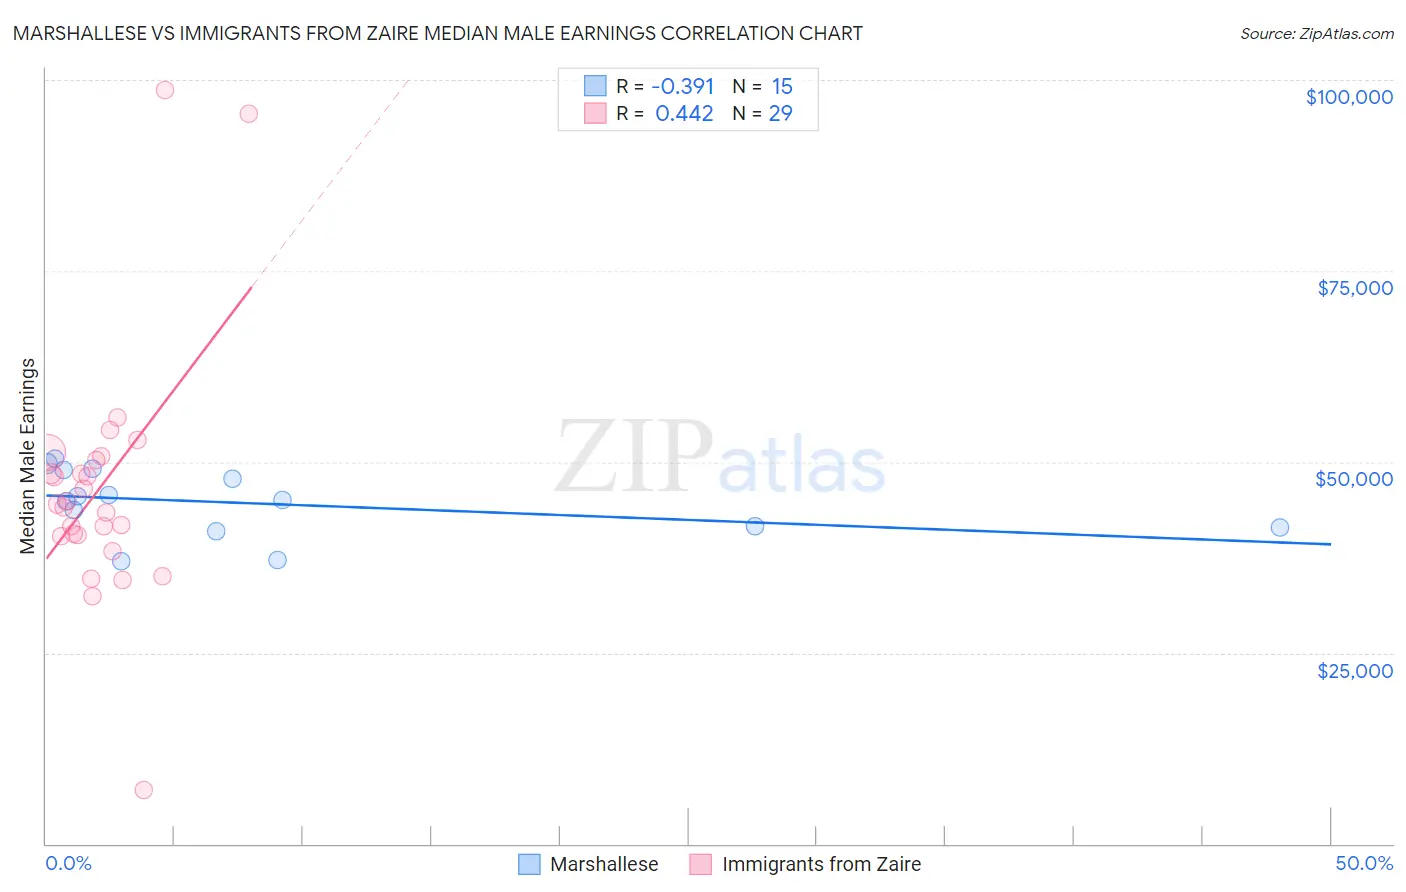
Marshallese vs Immigrants from Zaire Median Male Earnings Correlation Chart
The statistical analysis conducted on geographies consisting of 14,760,790 people shows a mild negative correlation between the proportion of Marshallese and median male earnings in the United States with a correlation coefficient (R) of -0.391 and weighted average of $48,137. Similarly, the statistical analysis conducted on geographies consisting of 107,252,506 people shows a moderate positive correlation between the proportion of Immigrants from Zaire and median male earnings in the United States with a correlation coefficient (R) of 0.442 and weighted average of $47,070, a difference of 2.3%.
Median Male Earnings Correlation Summary
| Measurement | Marshallese | Immigrants from Zaire |
| Minimum | $37,012 | $7,065 |
| Maximum | $50,395 | $98,750 |
| Range | $13,383 | $91,685 |
| Mean | $44,583 | $46,699 |
| Median | $45,000 | $44,438 |
| Interquartile 25% (IQ1) | $41,333 | $40,386 |
| Interquartile 75% (IQ3) | $48,969 | $50,511 |
| Interquartile Range (IQR) | $7,636 | $10,125 |
| Standard Deviation (Sample) | $4,286 | $16,725 |
| Standard Deviation (Population) | $4,141 | $16,434 |
Demographics Similar to Marshallese and Immigrants from Zaire by Median Male Earnings
In terms of median male earnings, the demographic groups most similar to Marshallese are Central American ($48,093, a difference of 0.090%), Comanche ($48,202, a difference of 0.13%), Immigrants from Jamaica ($48,040, a difference of 0.20%), African ($47,994, a difference of 0.30%), and Paiute ($47,991, a difference of 0.30%). Similarly, the demographic groups most similar to Immigrants from Zaire are U.S. Virgin Islander ($47,066, a difference of 0.010%), Immigrants from Micronesia ($47,177, a difference of 0.23%), Dominican ($47,204, a difference of 0.28%), Inupiat ($47,281, a difference of 0.45%), and Central American Indian ($47,433, a difference of 0.77%).
| Demographics | Rating | Rank | Median Male Earnings |
| Comanche | 0.2 /100 | #280 | Tragic $48,202 |
| Marshallese | 0.2 /100 | #281 | Tragic $48,137 |
| Central Americans | 0.2 /100 | #282 | Tragic $48,093 |
| Immigrants | Jamaica | 0.2 /100 | #283 | Tragic $48,040 |
| Africans | 0.2 /100 | #284 | Tragic $47,994 |
| Paiute | 0.2 /100 | #285 | Tragic $47,991 |
| Mexican American Indians | 0.2 /100 | #286 | Tragic $47,990 |
| Immigrants | El Salvador | 0.2 /100 | #287 | Tragic $47,973 |
| Shoshone | 0.2 /100 | #288 | Tragic $47,930 |
| Chickasaw | 0.1 /100 | #289 | Tragic $47,832 |
| Immigrants | Belize | 0.1 /100 | #290 | Tragic $47,809 |
| Choctaw | 0.1 /100 | #291 | Tragic $47,729 |
| Immigrants | Dominica | 0.1 /100 | #292 | Tragic $47,651 |
| Indonesians | 0.1 /100 | #293 | Tragic $47,503 |
| Immigrants | Nicaragua | 0.1 /100 | #294 | Tragic $47,482 |
| Central American Indians | 0.1 /100 | #295 | Tragic $47,433 |
| Inupiat | 0.1 /100 | #296 | Tragic $47,281 |
| Dominicans | 0.1 /100 | #297 | Tragic $47,204 |
| Immigrants | Micronesia | 0.1 /100 | #298 | Tragic $47,177 |
| Immigrants | Zaire | 0.1 /100 | #299 | Tragic $47,070 |
| U.S. Virgin Islanders | 0.1 /100 | #300 | Tragic $47,066 |