Korean vs Immigrants from Uganda Median Household Income
COMPARE
Korean
Immigrants from Uganda
Median Household Income
Median Household Income Comparison
Koreans
Immigrants from Uganda
$95,018
MEDIAN HOUSEHOLD INCOME
99.8/ 100
METRIC RATING
60th/ 347
METRIC RANK
$87,553
MEDIAN HOUSEHOLD INCOME
82.8/ 100
METRIC RATING
146th/ 347
METRIC RANK
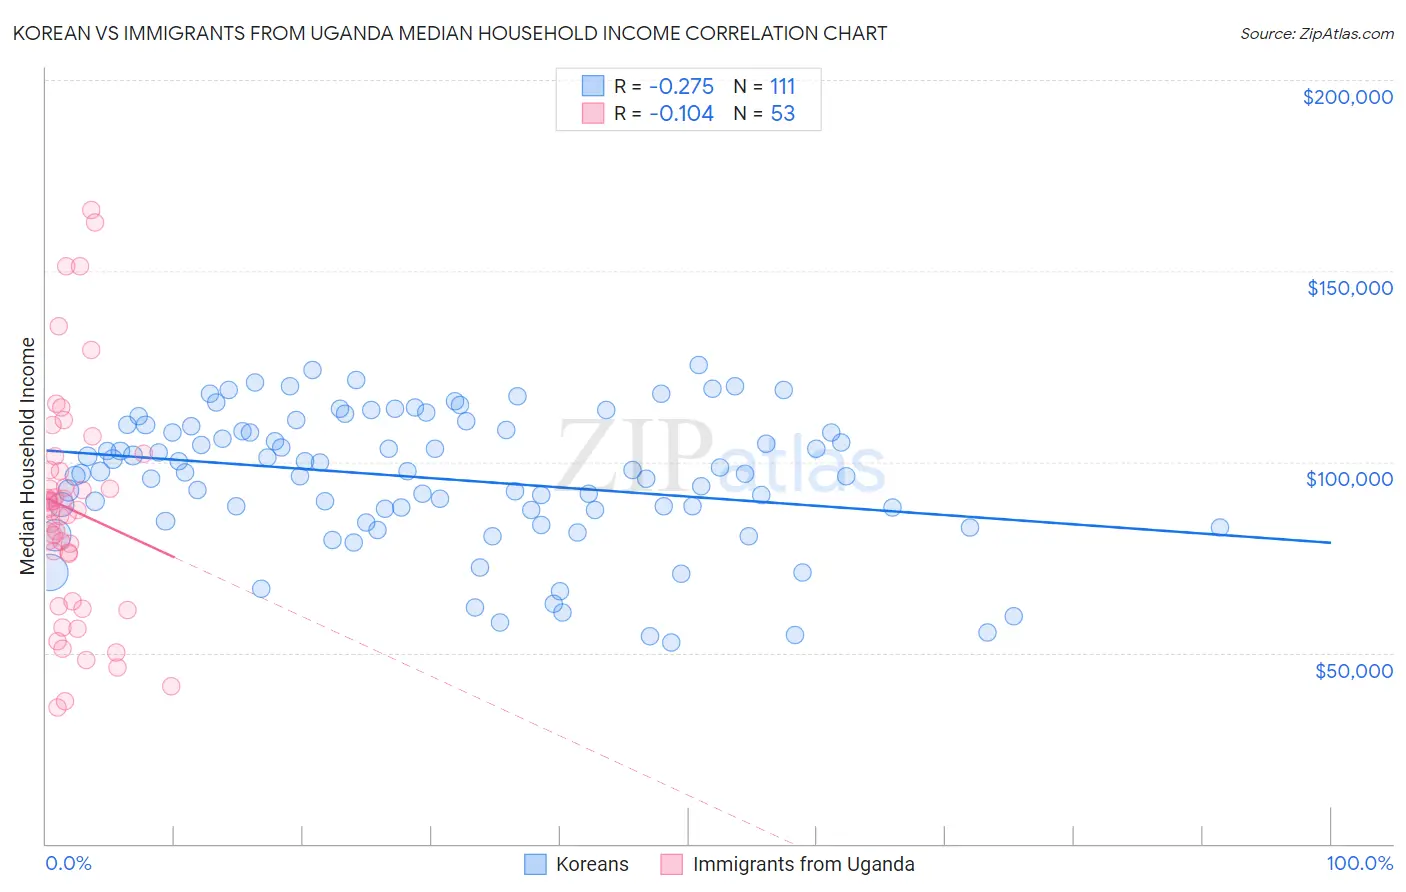
Korean vs Immigrants from Uganda Median Household Income Correlation Chart
The statistical analysis conducted on geographies consisting of 510,219,050 people shows a weak negative correlation between the proportion of Koreans and median household income in the United States with a correlation coefficient (R) of -0.275 and weighted average of $95,018. Similarly, the statistical analysis conducted on geographies consisting of 125,950,023 people shows a poor negative correlation between the proportion of Immigrants from Uganda and median household income in the United States with a correlation coefficient (R) of -0.104 and weighted average of $87,553, a difference of 8.5%.
Median Household Income Correlation Summary
| Measurement | Korean | Immigrants from Uganda |
| Minimum | $52,792 | $35,519 |
| Maximum | $125,300 | $166,111 |
| Range | $72,508 | $130,592 |
| Mean | $95,651 | $87,480 |
| Median | $97,407 | $87,386 |
| Interquartile 25% (IQ1) | $87,266 | $62,932 |
| Interquartile 75% (IQ3) | $109,366 | $99,670 |
| Interquartile Range (IQR) | $22,100 | $36,738 |
| Standard Deviation (Sample) | $17,558 | $30,184 |
| Standard Deviation (Population) | $17,478 | $29,898 |
Similar Demographics by Median Household Income
Demographics Similar to Koreans by Median Household Income
In terms of median household income, the demographic groups most similar to Koreans are Immigrants from Europe ($95,032, a difference of 0.020%), Laotian ($94,990, a difference of 0.030%), Soviet Union ($95,098, a difference of 0.080%), New Zealander ($95,146, a difference of 0.13%), and Immigrants from Norway ($94,846, a difference of 0.18%).
| Demographics | Rating | Rank | Median Household Income |
| Paraguayans | 99.9 /100 | #53 | Exceptional $95,737 |
| Egyptians | 99.9 /100 | #54 | Exceptional $95,673 |
| Immigrants | Czechoslovakia | 99.9 /100 | #55 | Exceptional $95,319 |
| Immigrants | Austria | 99.9 /100 | #56 | Exceptional $95,277 |
| New Zealanders | 99.8 /100 | #57 | Exceptional $95,146 |
| Soviet Union | 99.8 /100 | #58 | Exceptional $95,098 |
| Immigrants | Europe | 99.8 /100 | #59 | Exceptional $95,032 |
| Koreans | 99.8 /100 | #60 | Exceptional $95,018 |
| Laotians | 99.8 /100 | #61 | Exceptional $94,990 |
| Immigrants | Norway | 99.8 /100 | #62 | Exceptional $94,846 |
| Greeks | 99.8 /100 | #63 | Exceptional $94,735 |
| Immigrants | Netherlands | 99.7 /100 | #64 | Exceptional $94,411 |
| Immigrants | Belarus | 99.7 /100 | #65 | Exceptional $94,399 |
| Immigrants | Romania | 99.7 /100 | #66 | Exceptional $94,222 |
| Immigrants | Scotland | 99.7 /100 | #67 | Exceptional $94,091 |
Demographics Similar to Immigrants from Uganda by Median Household Income
In terms of median household income, the demographic groups most similar to Immigrants from Uganda are Ugandan ($87,557, a difference of 0.0%), Serbian ($87,572, a difference of 0.020%), South American Indian ($87,446, a difference of 0.12%), Danish ($87,676, a difference of 0.14%), and Canadian ($87,769, a difference of 0.25%).
| Demographics | Rating | Rank | Median Household Income |
| Immigrants | Chile | 89.2 /100 | #139 | Excellent $88,388 |
| Lebanese | 87.2 /100 | #140 | Excellent $88,091 |
| Immigrants | Morocco | 86.0 /100 | #141 | Excellent $87,930 |
| Canadians | 84.7 /100 | #142 | Excellent $87,769 |
| Danes | 83.9 /100 | #143 | Excellent $87,676 |
| Serbians | 83.0 /100 | #144 | Excellent $87,572 |
| Ugandans | 82.9 /100 | #145 | Excellent $87,557 |
| Immigrants | Uganda | 82.8 /100 | #146 | Excellent $87,553 |
| South American Indians | 81.8 /100 | #147 | Excellent $87,446 |
| Costa Ricans | 80.0 /100 | #148 | Excellent $87,262 |
| Immigrants | Nepal | 77.7 /100 | #149 | Good $87,046 |
| Basques | 77.2 /100 | #150 | Good $87,001 |
| Hungarians | 76.3 /100 | #151 | Good $86,920 |
| Immigrants | Saudi Arabia | 75.8 /100 | #152 | Good $86,875 |
| South Americans | 75.1 /100 | #153 | Good $86,824 |