Korean vs Greek Median Household Income
COMPARE
Korean
Greek
Median Household Income
Median Household Income Comparison
Koreans
Greeks
$95,018
MEDIAN HOUSEHOLD INCOME
99.8/ 100
METRIC RATING
60th/ 347
METRIC RANK
$94,735
MEDIAN HOUSEHOLD INCOME
99.8/ 100
METRIC RATING
63rd/ 347
METRIC RANK
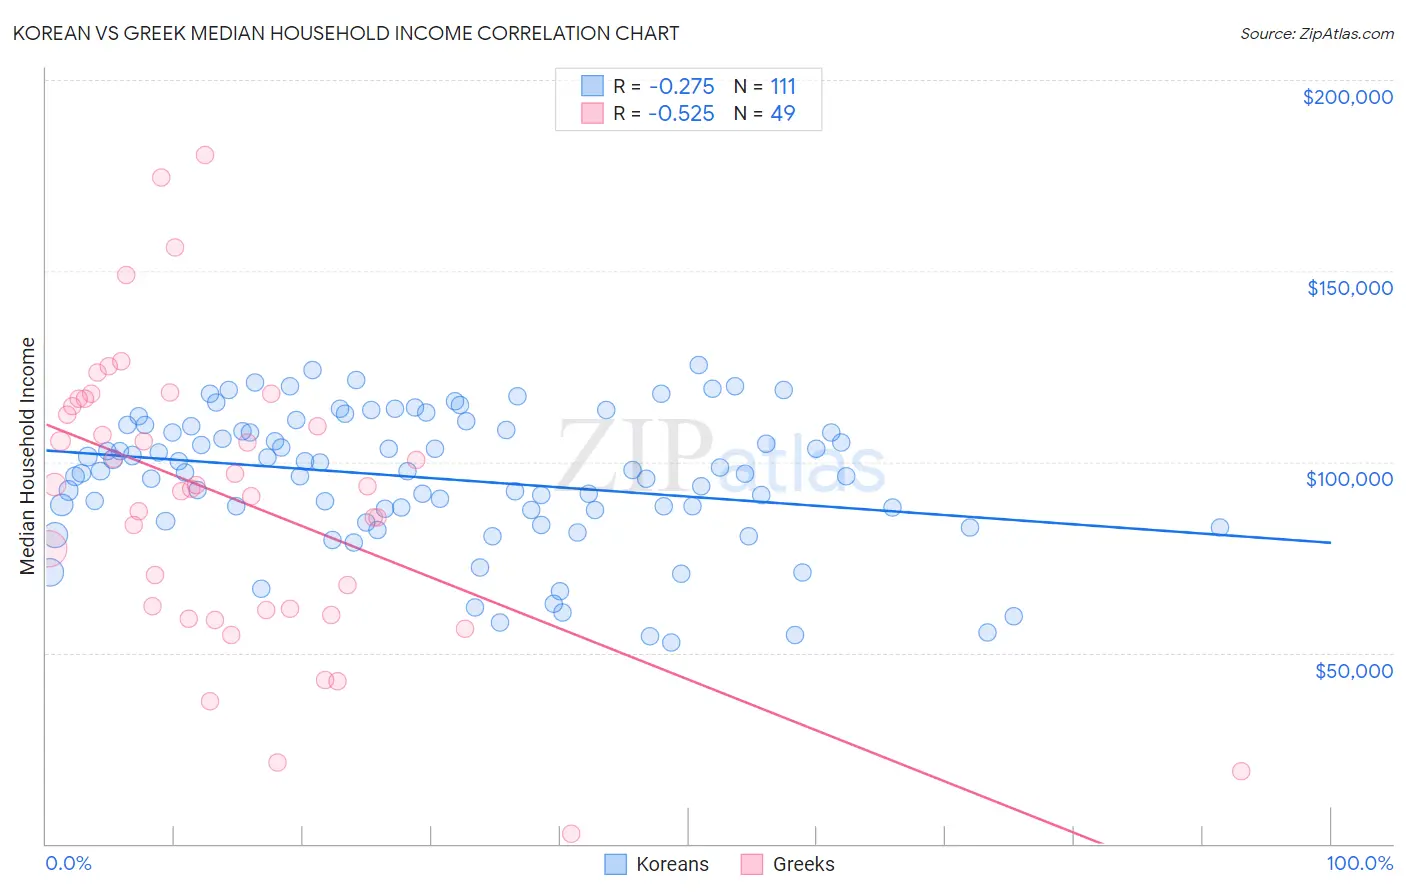
Korean vs Greek Median Household Income Correlation Chart
The statistical analysis conducted on geographies consisting of 510,219,050 people shows a weak negative correlation between the proportion of Koreans and median household income in the United States with a correlation coefficient (R) of -0.275 and weighted average of $95,018. Similarly, the statistical analysis conducted on geographies consisting of 482,222,552 people shows a substantial negative correlation between the proportion of Greeks and median household income in the United States with a correlation coefficient (R) of -0.525 and weighted average of $94,735, a difference of 0.30%.
Median Household Income Correlation Summary
| Measurement | Korean | Greek |
| Minimum | $52,792 | $2,499 |
| Maximum | $125,300 | $180,197 |
| Range | $72,508 | $177,698 |
| Mean | $95,651 | $90,436 |
| Median | $97,407 | $93,750 |
| Interquartile 25% (IQ1) | $87,266 | $61,372 |
| Interquartile 75% (IQ3) | $109,366 | $115,471 |
| Interquartile Range (IQR) | $22,100 | $54,098 |
| Standard Deviation (Sample) | $17,558 | $37,295 |
| Standard Deviation (Population) | $17,478 | $36,913 |
Demographics Similar to Koreans and Greeks by Median Household Income
In terms of median household income, the demographic groups most similar to Koreans are Immigrants from Europe ($95,032, a difference of 0.020%), Laotian ($94,990, a difference of 0.030%), Soviet Union ($95,098, a difference of 0.080%), New Zealander ($95,146, a difference of 0.13%), and Immigrants from Norway ($94,846, a difference of 0.18%). Similarly, the demographic groups most similar to Greeks are Immigrants from Norway ($94,846, a difference of 0.12%), Laotian ($94,990, a difference of 0.27%), Immigrants from Europe ($95,032, a difference of 0.31%), Immigrants from Netherlands ($94,411, a difference of 0.34%), and Immigrants from Belarus ($94,399, a difference of 0.36%).
| Demographics | Rating | Rank | Median Household Income |
| Estonians | 99.9 /100 | #51 | Exceptional $95,930 |
| Immigrants | South Africa | 99.9 /100 | #52 | Exceptional $95,800 |
| Paraguayans | 99.9 /100 | #53 | Exceptional $95,737 |
| Egyptians | 99.9 /100 | #54 | Exceptional $95,673 |
| Immigrants | Czechoslovakia | 99.9 /100 | #55 | Exceptional $95,319 |
| Immigrants | Austria | 99.9 /100 | #56 | Exceptional $95,277 |
| New Zealanders | 99.8 /100 | #57 | Exceptional $95,146 |
| Soviet Union | 99.8 /100 | #58 | Exceptional $95,098 |
| Immigrants | Europe | 99.8 /100 | #59 | Exceptional $95,032 |
| Koreans | 99.8 /100 | #60 | Exceptional $95,018 |
| Laotians | 99.8 /100 | #61 | Exceptional $94,990 |
| Immigrants | Norway | 99.8 /100 | #62 | Exceptional $94,846 |
| Greeks | 99.8 /100 | #63 | Exceptional $94,735 |
| Immigrants | Netherlands | 99.7 /100 | #64 | Exceptional $94,411 |
| Immigrants | Belarus | 99.7 /100 | #65 | Exceptional $94,399 |
| Immigrants | Romania | 99.7 /100 | #66 | Exceptional $94,222 |
| Immigrants | Scotland | 99.7 /100 | #67 | Exceptional $94,091 |
| Mongolians | 99.7 /100 | #68 | Exceptional $93,971 |
| Argentineans | 99.7 /100 | #69 | Exceptional $93,960 |
| Immigrants | Fiji | 99.7 /100 | #70 | Exceptional $93,933 |
| Immigrants | Philippines | 99.6 /100 | #71 | Exceptional $93,899 |