Korean vs Immigrants from China Wage/Income Gap
COMPARE
Korean
Immigrants from China
Wage/Income Gap
Wage/Income Gap Comparison
Koreans
Immigrants from China
25.4%
WAGE/INCOME GAP
68.6/ 100
METRIC RATING
164th/ 347
METRIC RANK
26.7%
WAGE/INCOME GAP
10.3/ 100
METRIC RATING
214th/ 347
METRIC RANK
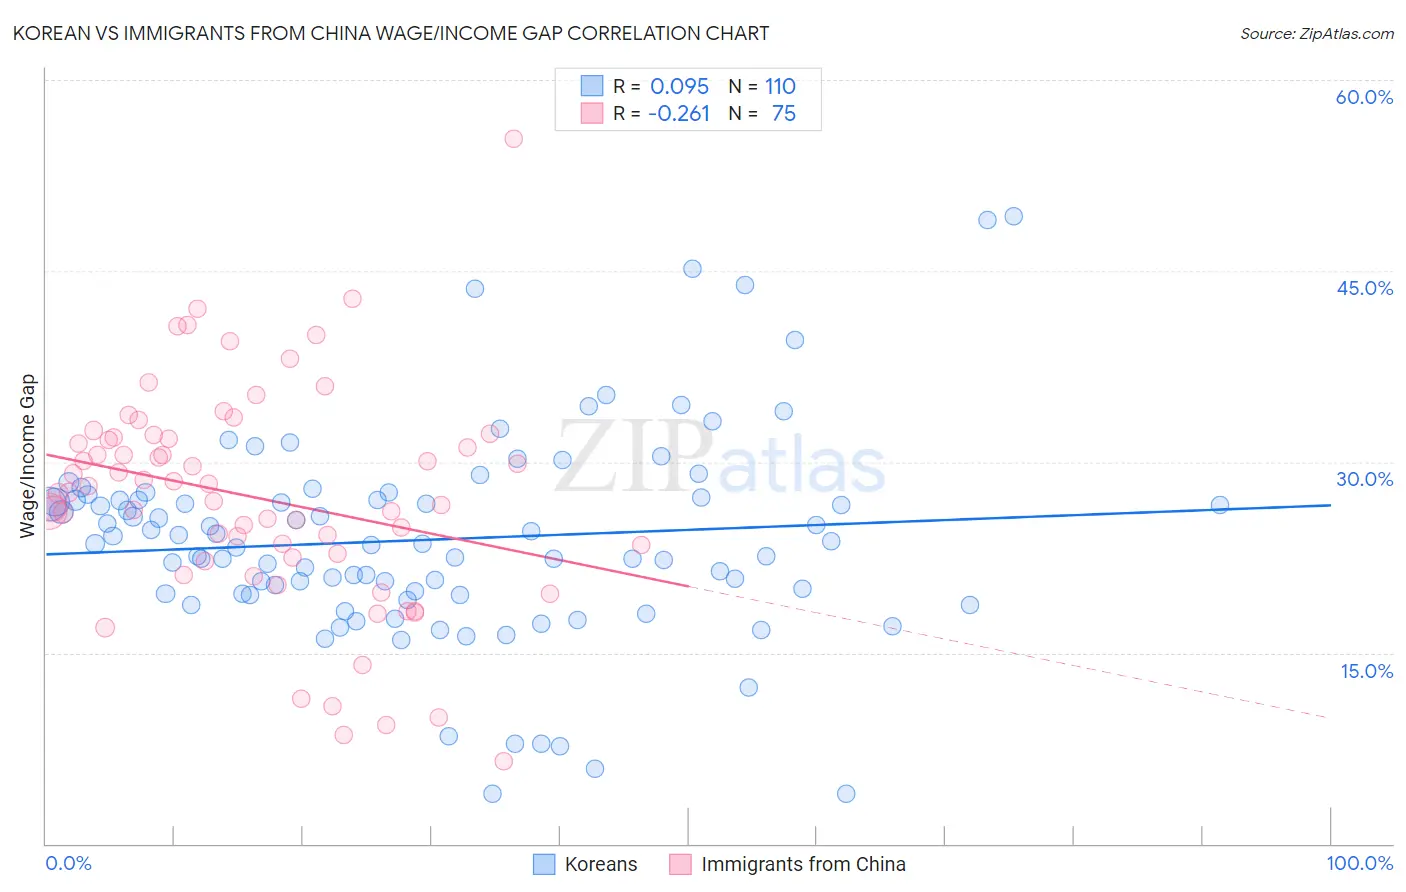
Korean vs Immigrants from China Wage/Income Gap Correlation Chart
The statistical analysis conducted on geographies consisting of 510,260,978 people shows a slight positive correlation between the proportion of Koreans and wage/income gap percentage in the United States with a correlation coefficient (R) of 0.095 and weighted average of 25.4%. Similarly, the statistical analysis conducted on geographies consisting of 456,702,733 people shows a weak negative correlation between the proportion of Immigrants from China and wage/income gap percentage in the United States with a correlation coefficient (R) of -0.261 and weighted average of 26.7%, a difference of 4.9%.
Wage/Income Gap Correlation Summary
| Measurement | Korean | Immigrants from China |
| Minimum | 3.9% | 6.5% |
| Maximum | 49.3% | 55.3% |
| Range | 45.4% | 48.9% |
| Mean | 23.9% | 27.2% |
| Median | 23.6% | 27.6% |
| Interquartile 25% (IQ1) | 19.6% | 22.4% |
| Interquartile 75% (IQ3) | 27.0% | 31.9% |
| Interquartile Range (IQR) | 7.4% | 9.5% |
| Standard Deviation (Sample) | 8.1% | 8.7% |
| Standard Deviation (Population) | 8.1% | 8.6% |
Similar Demographics by Wage/Income Gap
Demographics Similar to Koreans by Wage/Income Gap
In terms of wage/income gap, the demographic groups most similar to Koreans are Native Hawaiian (25.4%, a difference of 0.030%), Shoshone (25.4%, a difference of 0.040%), Albanian (25.4%, a difference of 0.060%), French American Indian (25.4%, a difference of 0.32%), and Immigrants from Hong Kong (25.5%, a difference of 0.34%).
| Demographics | Rating | Rank | Wage/Income Gap |
| Costa Ricans | 75.8 /100 | #157 | Good 25.3% |
| Immigrants | Zimbabwe | 73.7 /100 | #158 | Good 25.3% |
| Puget Sound Salish | 73.0 /100 | #159 | Good 25.3% |
| French American Indians | 72.5 /100 | #160 | Good 25.4% |
| Albanians | 69.4 /100 | #161 | Good 25.4% |
| Shoshone | 69.0 /100 | #162 | Good 25.4% |
| Native Hawaiians | 69.0 /100 | #163 | Good 25.4% |
| Koreans | 68.6 /100 | #164 | Good 25.4% |
| Immigrants | Hong Kong | 64.0 /100 | #165 | Good 25.5% |
| Immigrants | Ukraine | 63.8 /100 | #166 | Good 25.5% |
| Paiute | 62.9 /100 | #167 | Good 25.5% |
| Seminole | 62.6 /100 | #168 | Good 25.6% |
| Peruvians | 60.1 /100 | #169 | Good 25.6% |
| Immigrants | Oceania | 57.5 /100 | #170 | Average 25.6% |
| Immigrants | Greece | 56.6 /100 | #171 | Average 25.7% |
Demographics Similar to Immigrants from China by Wage/Income Gap
In terms of wage/income gap, the demographic groups most similar to Immigrants from China are Immigrants from Iraq (26.7%, a difference of 0.010%), Yugoslavian (26.7%, a difference of 0.090%), Immigrants from Portugal (26.7%, a difference of 0.13%), Iraqi (26.6%, a difference of 0.16%), and Mongolian (26.6%, a difference of 0.19%).
| Demographics | Rating | Rank | Wage/Income Gap |
| Immigrants | Italy | 15.8 /100 | #207 | Poor 26.5% |
| Egyptians | 12.7 /100 | #208 | Poor 26.6% |
| Immigrants | Kuwait | 12.6 /100 | #209 | Poor 26.6% |
| Arabs | 12.3 /100 | #210 | Poor 26.6% |
| Mongolians | 11.4 /100 | #211 | Poor 26.6% |
| Iraqis | 11.2 /100 | #212 | Poor 26.6% |
| Immigrants | Iraq | 10.3 /100 | #213 | Poor 26.7% |
| Immigrants | China | 10.3 /100 | #214 | Poor 26.7% |
| Yugoslavians | 9.7 /100 | #215 | Tragic 26.7% |
| Immigrants | Portugal | 9.5 /100 | #216 | Tragic 26.7% |
| Brazilians | 9.2 /100 | #217 | Tragic 26.7% |
| Immigrants | Saudi Arabia | 9.1 /100 | #218 | Tragic 26.7% |
| Immigrants | Poland | 8.9 /100 | #219 | Tragic 26.7% |
| Immigrants | Latvia | 8.9 /100 | #220 | Tragic 26.7% |
| Immigrants | Spain | 8.5 /100 | #221 | Tragic 26.8% |