Irish vs Immigrants from Saudi Arabia Median Family Income
COMPARE
Irish
Immigrants from Saudi Arabia
Median Family Income
Median Family Income Comparison
Irish
Immigrants from Saudi Arabia
$105,453
MEDIAN FAMILY INCOME
80.5/ 100
METRIC RATING
150th/ 347
METRIC RANK
$108,544
MEDIAN FAMILY INCOME
95.2/ 100
METRIC RATING
113th/ 347
METRIC RANK
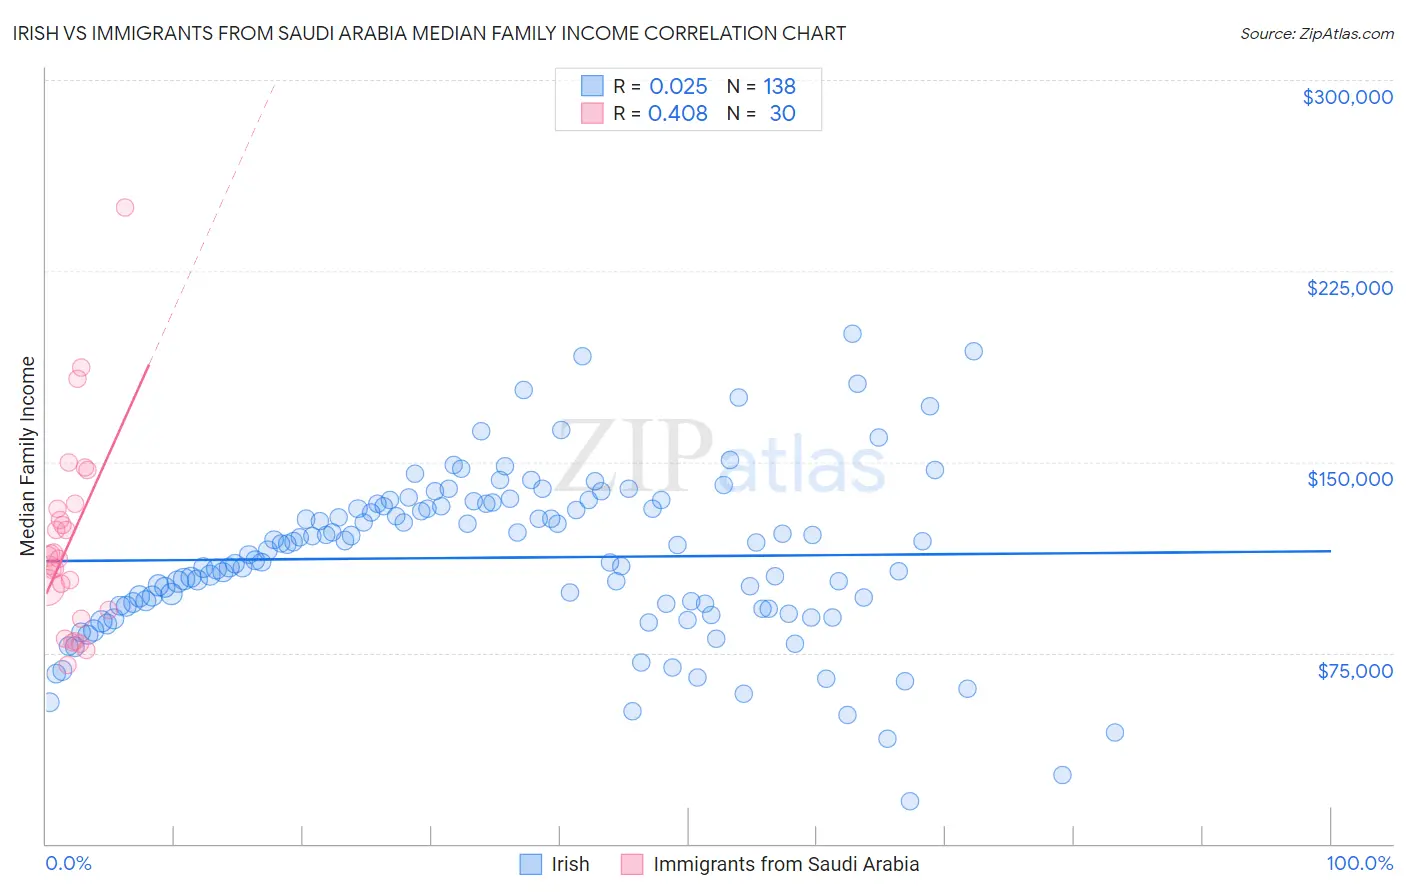
Irish vs Immigrants from Saudi Arabia Median Family Income Correlation Chart
The statistical analysis conducted on geographies consisting of 578,674,482 people shows no correlation between the proportion of Irish and median family income in the United States with a correlation coefficient (R) of 0.025 and weighted average of $105,453. Similarly, the statistical analysis conducted on geographies consisting of 164,179,276 people shows a moderate positive correlation between the proportion of Immigrants from Saudi Arabia and median family income in the United States with a correlation coefficient (R) of 0.408 and weighted average of $108,544, a difference of 2.9%.
Median Family Income Correlation Summary
| Measurement | Irish | Immigrants from Saudi Arabia |
| Minimum | $16,721 | $70,185 |
| Maximum | $200,267 | $250,001 |
| Range | $183,546 | $179,816 |
| Mean | $112,390 | $118,570 |
| Median | $114,410 | $112,390 |
| Interquartile 25% (IQ1) | $93,102 | $92,019 |
| Interquartile 75% (IQ3) | $132,553 | $131,535 |
| Interquartile Range (IQR) | $39,451 | $39,516 |
| Standard Deviation (Sample) | $32,421 | $38,218 |
| Standard Deviation (Population) | $32,303 | $37,576 |
Similar Demographics by Median Family Income
Demographics Similar to Irish by Median Family Income
In terms of median family income, the demographic groups most similar to Irish are Peruvian ($105,444, a difference of 0.010%), Immigrants from Germany ($105,507, a difference of 0.050%), Hungarian ($105,609, a difference of 0.15%), Immigrants from Albania ($105,285, a difference of 0.16%), and Immigrants from Chile ($105,655, a difference of 0.19%).
| Demographics | Rating | Rank | Median Family Income |
| Tongans | 84.3 /100 | #143 | Excellent $105,967 |
| Immigrants | Morocco | 84.3 /100 | #144 | Excellent $105,964 |
| Danes | 83.8 /100 | #145 | Excellent $105,900 |
| Czechs | 83.4 /100 | #146 | Excellent $105,839 |
| Immigrants | Chile | 82.1 /100 | #147 | Excellent $105,655 |
| Hungarians | 81.7 /100 | #148 | Excellent $105,609 |
| Immigrants | Germany | 80.9 /100 | #149 | Excellent $105,507 |
| Irish | 80.5 /100 | #150 | Excellent $105,453 |
| Peruvians | 80.4 /100 | #151 | Excellent $105,444 |
| Immigrants | Albania | 79.1 /100 | #152 | Good $105,285 |
| Slavs | 77.9 /100 | #153 | Good $105,144 |
| Immigrants | Nepal | 76.3 /100 | #154 | Good $104,966 |
| Native Hawaiians | 75.8 /100 | #155 | Good $104,910 |
| Basques | 74.4 /100 | #156 | Good $104,760 |
| Moroccans | 71.6 /100 | #157 | Good $104,488 |
Demographics Similar to Immigrants from Saudi Arabia by Median Family Income
In terms of median family income, the demographic groups most similar to Immigrants from Saudi Arabia are Immigrants from Poland ($108,570, a difference of 0.020%), Polish ($108,507, a difference of 0.030%), Swedish ($108,499, a difference of 0.040%), Chilean ($108,429, a difference of 0.11%), and Immigrants from Western Asia ($108,691, a difference of 0.14%).
| Demographics | Rating | Rank | Median Family Income |
| Albanians | 96.4 /100 | #106 | Exceptional $109,136 |
| Immigrants | North Macedonia | 96.4 /100 | #107 | Exceptional $109,136 |
| Immigrants | Zimbabwe | 95.9 /100 | #108 | Exceptional $108,830 |
| Immigrants | Afghanistan | 95.6 /100 | #109 | Exceptional $108,709 |
| British | 95.6 /100 | #110 | Exceptional $108,705 |
| Immigrants | Western Asia | 95.6 /100 | #111 | Exceptional $108,691 |
| Immigrants | Poland | 95.3 /100 | #112 | Exceptional $108,570 |
| Immigrants | Saudi Arabia | 95.2 /100 | #113 | Exceptional $108,544 |
| Poles | 95.2 /100 | #114 | Exceptional $108,507 |
| Swedes | 95.1 /100 | #115 | Exceptional $108,499 |
| Chileans | 95.0 /100 | #116 | Exceptional $108,429 |
| Immigrants | Philippines | 94.6 /100 | #117 | Exceptional $108,288 |
| Ethiopians | 94.5 /100 | #118 | Exceptional $108,251 |
| Sri Lankans | 94.5 /100 | #119 | Exceptional $108,234 |
| Immigrants | Northern Africa | 94.3 /100 | #120 | Exceptional $108,161 |