Immigrants from Spain vs Immigrants from Saudi Arabia Median Family Income
COMPARE
Immigrants from Spain
Immigrants from Saudi Arabia
Median Family Income
Median Family Income Comparison
Immigrants from Spain
Immigrants from Saudi Arabia
$113,815
MEDIAN FAMILY INCOME
99.7/ 100
METRIC RATING
67th/ 347
METRIC RANK
$108,544
MEDIAN FAMILY INCOME
95.2/ 100
METRIC RATING
113th/ 347
METRIC RANK
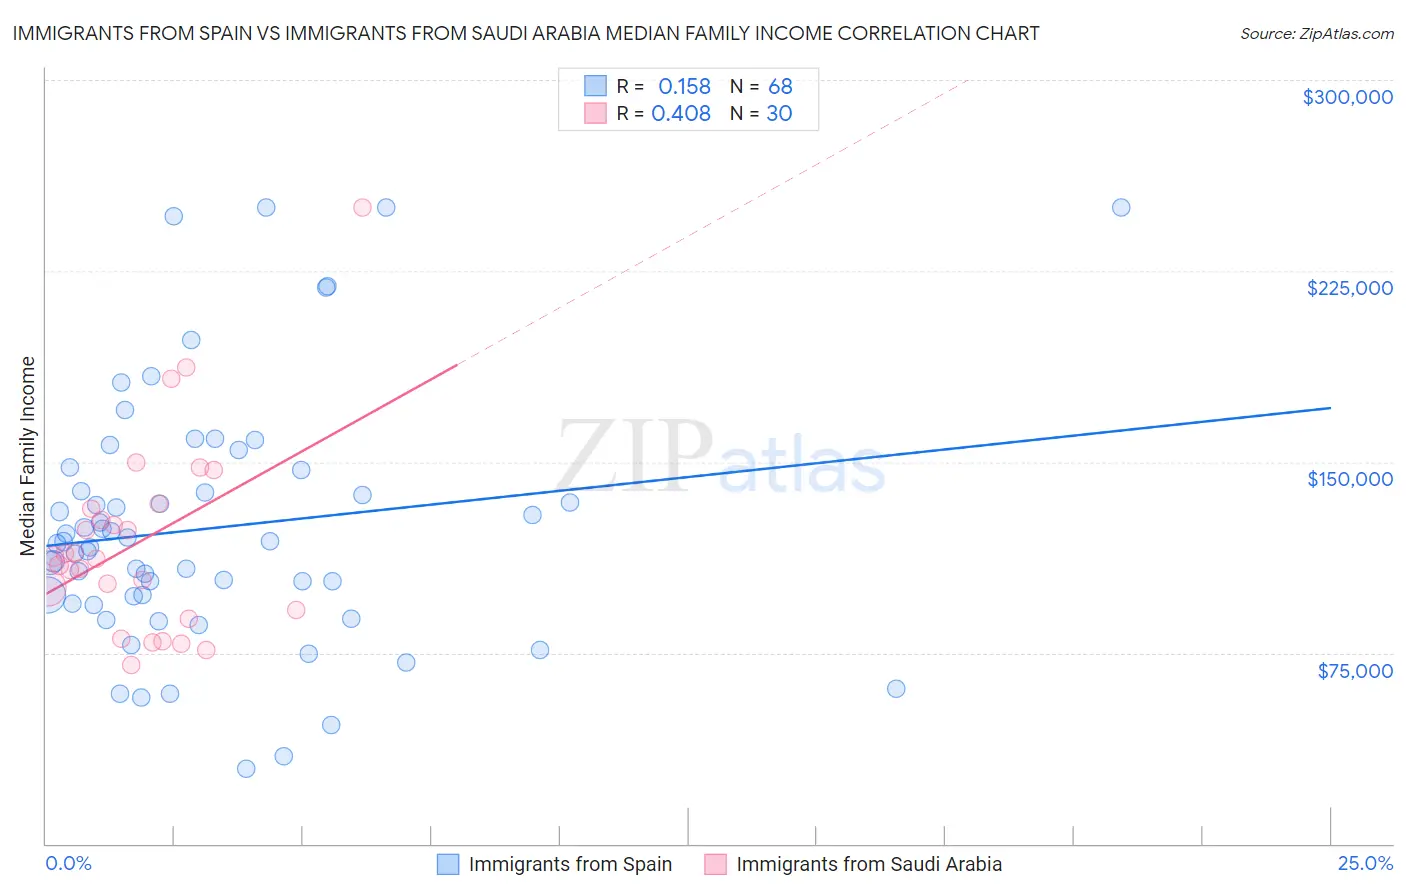
Immigrants from Spain vs Immigrants from Saudi Arabia Median Family Income Correlation Chart
The statistical analysis conducted on geographies consisting of 239,551,632 people shows a poor positive correlation between the proportion of Immigrants from Spain and median family income in the United States with a correlation coefficient (R) of 0.158 and weighted average of $113,815. Similarly, the statistical analysis conducted on geographies consisting of 164,179,276 people shows a moderate positive correlation between the proportion of Immigrants from Saudi Arabia and median family income in the United States with a correlation coefficient (R) of 0.408 and weighted average of $108,544, a difference of 4.9%.
Median Family Income Correlation Summary
| Measurement | Immigrants from Spain | Immigrants from Saudi Arabia |
| Minimum | $29,286 | $70,185 |
| Maximum | $250,001 | $250,001 |
| Range | $220,715 | $179,816 |
| Mean | $124,049 | $118,570 |
| Median | $118,215 | $112,390 |
| Interquartile 25% (IQ1) | $95,635 | $92,019 |
| Interquartile 75% (IQ3) | $142,548 | $131,535 |
| Interquartile Range (IQR) | $46,913 | $39,516 |
| Standard Deviation (Sample) | $49,625 | $38,218 |
| Standard Deviation (Population) | $49,259 | $37,576 |
Similar Demographics by Median Family Income
Demographics Similar to Immigrants from Spain by Median Family Income
In terms of median family income, the demographic groups most similar to Immigrants from Spain are Paraguayan ($114,016, a difference of 0.18%), Egyptian ($114,119, a difference of 0.27%), Immigrants from Serbia ($113,463, a difference of 0.31%), Immigrants from Bulgaria ($113,461, a difference of 0.31%), and Immigrants from Romania ($113,434, a difference of 0.34%).
| Demographics | Rating | Rank | Median Family Income |
| Immigrants | Latvia | 99.8 /100 | #60 | Exceptional $114,826 |
| Immigrants | Belarus | 99.8 /100 | #61 | Exceptional $114,586 |
| Mongolians | 99.8 /100 | #62 | Exceptional $114,553 |
| Immigrants | Pakistan | 99.8 /100 | #63 | Exceptional $114,406 |
| Immigrants | Scotland | 99.7 /100 | #64 | Exceptional $114,392 |
| Egyptians | 99.7 /100 | #65 | Exceptional $114,119 |
| Paraguayans | 99.7 /100 | #66 | Exceptional $114,016 |
| Immigrants | Spain | 99.7 /100 | #67 | Exceptional $113,815 |
| Immigrants | Serbia | 99.6 /100 | #68 | Exceptional $113,463 |
| Immigrants | Bulgaria | 99.6 /100 | #69 | Exceptional $113,461 |
| Immigrants | Romania | 99.6 /100 | #70 | Exceptional $113,434 |
| South Africans | 99.5 /100 | #71 | Exceptional $113,229 |
| Afghans | 99.5 /100 | #72 | Exceptional $112,971 |
| Laotians | 99.5 /100 | #73 | Exceptional $112,859 |
| Immigrants | Italy | 99.4 /100 | #74 | Exceptional $112,848 |
Demographics Similar to Immigrants from Saudi Arabia by Median Family Income
In terms of median family income, the demographic groups most similar to Immigrants from Saudi Arabia are Immigrants from Poland ($108,570, a difference of 0.020%), Polish ($108,507, a difference of 0.030%), Swedish ($108,499, a difference of 0.040%), Chilean ($108,429, a difference of 0.11%), and Immigrants from Western Asia ($108,691, a difference of 0.14%).
| Demographics | Rating | Rank | Median Family Income |
| Albanians | 96.4 /100 | #106 | Exceptional $109,136 |
| Immigrants | North Macedonia | 96.4 /100 | #107 | Exceptional $109,136 |
| Immigrants | Zimbabwe | 95.9 /100 | #108 | Exceptional $108,830 |
| Immigrants | Afghanistan | 95.6 /100 | #109 | Exceptional $108,709 |
| British | 95.6 /100 | #110 | Exceptional $108,705 |
| Immigrants | Western Asia | 95.6 /100 | #111 | Exceptional $108,691 |
| Immigrants | Poland | 95.3 /100 | #112 | Exceptional $108,570 |
| Immigrants | Saudi Arabia | 95.2 /100 | #113 | Exceptional $108,544 |
| Poles | 95.2 /100 | #114 | Exceptional $108,507 |
| Swedes | 95.1 /100 | #115 | Exceptional $108,499 |
| Chileans | 95.0 /100 | #116 | Exceptional $108,429 |
| Immigrants | Philippines | 94.6 /100 | #117 | Exceptional $108,288 |
| Ethiopians | 94.5 /100 | #118 | Exceptional $108,251 |
| Sri Lankans | 94.5 /100 | #119 | Exceptional $108,234 |
| Immigrants | Northern Africa | 94.3 /100 | #120 | Exceptional $108,161 |