Inupiat vs Immigrants from Cambodia Median Household Income
COMPARE
Inupiat
Immigrants from Cambodia
Median Household Income
Median Household Income Comparison
Inupiat
Immigrants from Cambodia
$78,841
MEDIAN HOUSEHOLD INCOME
1.8/ 100
METRIC RATING
245th/ 347
METRIC RANK
$83,304
MEDIAN HOUSEHOLD INCOME
24.0/ 100
METRIC RATING
203rd/ 347
METRIC RANK
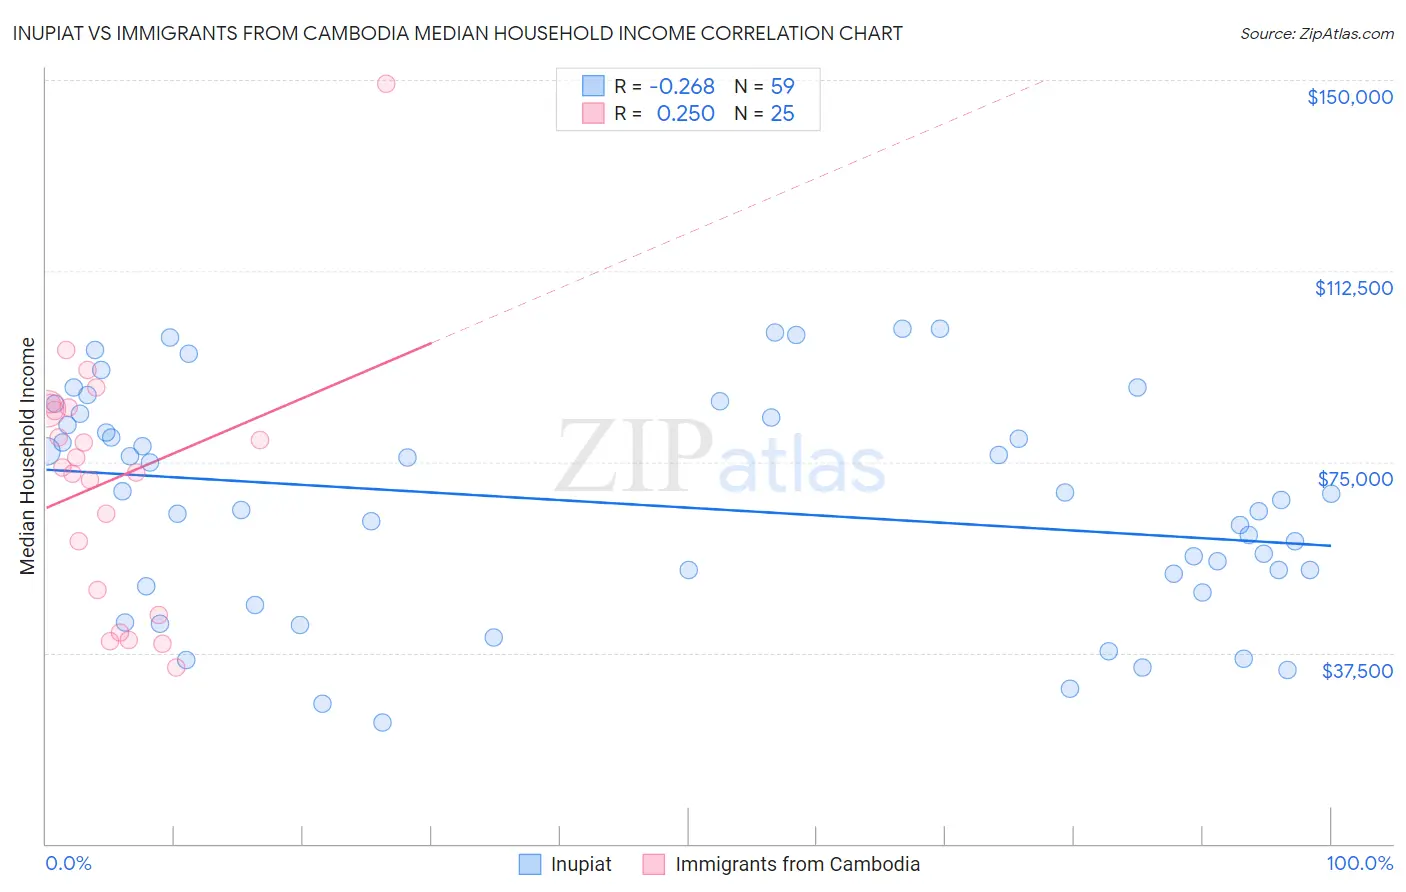
Inupiat vs Immigrants from Cambodia Median Household Income Correlation Chart
The statistical analysis conducted on geographies consisting of 96,314,941 people shows a weak negative correlation between the proportion of Inupiat and median household income in the United States with a correlation coefficient (R) of -0.268 and weighted average of $78,841. Similarly, the statistical analysis conducted on geographies consisting of 205,122,161 people shows a weak positive correlation between the proportion of Immigrants from Cambodia and median household income in the United States with a correlation coefficient (R) of 0.250 and weighted average of $83,304, a difference of 5.7%.
Median Household Income Correlation Summary
| Measurement | Inupiat | Immigrants from Cambodia |
| Minimum | $23,889 | $34,518 |
| Maximum | $101,071 | $149,239 |
| Range | $77,182 | $114,721 |
| Mean | $66,659 | $71,594 |
| Median | $67,500 | $73,842 |
| Interquartile 25% (IQ1) | $50,572 | $47,361 |
| Interquartile 75% (IQ3) | $83,750 | $85,484 |
| Interquartile Range (IQR) | $33,178 | $38,123 |
| Standard Deviation (Sample) | $21,353 | $25,130 |
| Standard Deviation (Population) | $21,171 | $24,622 |
Similar Demographics by Median Household Income
Demographics Similar to Inupiat by Median Household Income
In terms of median household income, the demographic groups most similar to Inupiat are Central American ($78,803, a difference of 0.050%), Marshallese ($78,930, a difference of 0.11%), Immigrants from Barbados ($78,989, a difference of 0.19%), Immigrants from Burma/Myanmar ($78,682, a difference of 0.20%), and Immigrants from Sudan ($79,103, a difference of 0.33%).
| Demographics | Rating | Rank | Median Household Income |
| Barbadians | 3.0 /100 | #238 | Tragic $79,664 |
| Alaska Natives | 2.7 /100 | #239 | Tragic $79,509 |
| Immigrants | Western Africa | 2.7 /100 | #240 | Tragic $79,490 |
| Immigrants | Nonimmigrants | 2.6 /100 | #241 | Tragic $79,429 |
| Immigrants | Sudan | 2.1 /100 | #242 | Tragic $79,103 |
| Immigrants | Barbados | 1.9 /100 | #243 | Tragic $78,989 |
| Marshallese | 1.9 /100 | #244 | Tragic $78,930 |
| Inupiat | 1.8 /100 | #245 | Tragic $78,841 |
| Central Americans | 1.7 /100 | #246 | Tragic $78,803 |
| Immigrants | Burma/Myanmar | 1.6 /100 | #247 | Tragic $78,682 |
| Sudanese | 1.5 /100 | #248 | Tragic $78,529 |
| West Indians | 1.4 /100 | #249 | Tragic $78,455 |
| Immigrants | Laos | 1.3 /100 | #250 | Tragic $78,327 |
| Mexican American Indians | 1.2 /100 | #251 | Tragic $78,166 |
| Immigrants | West Indies | 1.0 /100 | #252 | Tragic $77,956 |
Demographics Similar to Immigrants from Cambodia by Median Household Income
In terms of median household income, the demographic groups most similar to Immigrants from Cambodia are Immigrants from Africa ($83,289, a difference of 0.020%), Immigrants from Thailand ($83,327, a difference of 0.030%), Tsimshian ($83,346, a difference of 0.050%), Spanish ($83,343, a difference of 0.050%), and German ($83,358, a difference of 0.070%).
| Demographics | Rating | Rank | Median Household Income |
| French | 26.0 /100 | #196 | Fair $83,468 |
| Aleuts | 25.7 /100 | #197 | Fair $83,446 |
| Japanese | 25.1 /100 | #198 | Fair $83,395 |
| Germans | 24.6 /100 | #199 | Fair $83,358 |
| Tsimshian | 24.5 /100 | #200 | Fair $83,346 |
| Spanish | 24.4 /100 | #201 | Fair $83,343 |
| Immigrants | Thailand | 24.3 /100 | #202 | Fair $83,327 |
| Immigrants | Cambodia | 24.0 /100 | #203 | Fair $83,304 |
| Immigrants | Africa | 23.8 /100 | #204 | Fair $83,289 |
| Celtics | 22.7 /100 | #205 | Fair $83,193 |
| Immigrants | Kenya | 21.3 /100 | #206 | Fair $83,068 |
| Dutch | 20.3 /100 | #207 | Fair $82,971 |
| French Canadians | 18.7 /100 | #208 | Poor $82,810 |
| Immigrants | Iraq | 16.7 /100 | #209 | Poor $82,594 |
| Immigrants | Uruguay | 16.4 /100 | #210 | Poor $82,560 |