Inupiat vs Hopi Wage/Income Gap
COMPARE
Inupiat
Hopi
Wage/Income Gap
Wage/Income Gap Comparison
Inupiat
Hopi
20.8%
WAGE/INCOME GAP
100.0/ 100
METRIC RATING
28th/ 347
METRIC RANK
20.0%
WAGE/INCOME GAP
100.0/ 100
METRIC RATING
18th/ 347
METRIC RANK
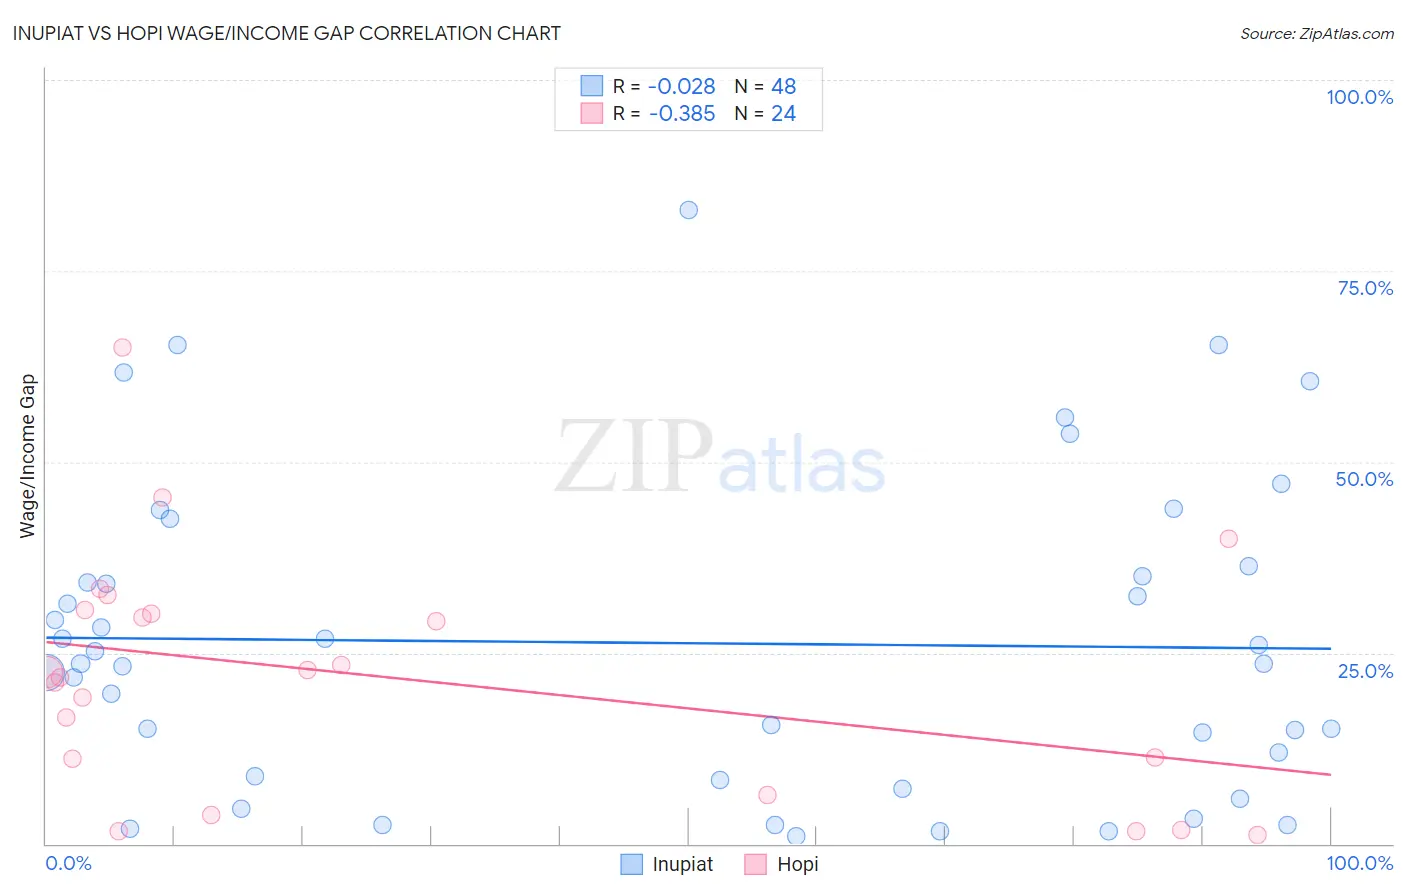
Inupiat vs Hopi Wage/Income Gap Correlation Chart
The statistical analysis conducted on geographies consisting of 96,290,792 people shows no correlation between the proportion of Inupiat and wage/income gap percentage in the United States with a correlation coefficient (R) of -0.028 and weighted average of 20.8%. Similarly, the statistical analysis conducted on geographies consisting of 74,717,570 people shows a mild negative correlation between the proportion of Hopi and wage/income gap percentage in the United States with a correlation coefficient (R) of -0.385 and weighted average of 20.0%, a difference of 3.8%.
Wage/Income Gap Correlation Summary
| Measurement | Inupiat | Hopi |
| Minimum | 0.97% | 1.1% |
| Maximum | 83.0% | 65.0% |
| Range | 82.0% | 64.0% |
| Mean | 26.3% | 21.7% |
| Median | 23.6% | 22.1% |
| Interquartile 25% (IQ1) | 8.6% | 8.7% |
| Interquartile 75% (IQ3) | 35.7% | 30.3% |
| Interquartile Range (IQR) | 27.1% | 21.6% |
| Standard Deviation (Sample) | 20.4% | 15.8% |
| Standard Deviation (Population) | 20.2% | 15.5% |
Demographics Similar to Inupiat and Hopi by Wage/Income Gap
In terms of wage/income gap, the demographic groups most similar to Inupiat are Immigrants from Armenia (20.7%, a difference of 0.23%), Pueblo (20.7%, a difference of 0.43%), Senegalese (20.7%, a difference of 0.54%), Immigrants from Senegal (20.9%, a difference of 0.62%), and Immigrants from Bangladesh (20.9%, a difference of 0.84%). Similarly, the demographic groups most similar to Hopi are Immigrants from Dominica (20.0%, a difference of 0.060%), Bahamian (20.2%, a difference of 1.2%), Haitian (19.7%, a difference of 1.4%), Immigrants from Caribbean (20.4%, a difference of 1.9%), and Jamaican (19.6%, a difference of 2.2%).
| Demographics | Rating | Rank | Wage/Income Gap |
| Trinidadians and Tobagonians | 100.0 /100 | #13 | Exceptional 19.3% |
| Immigrants | Trinidad and Tobago | 100.0 /100 | #14 | Exceptional 19.3% |
| West Indians | 100.0 /100 | #15 | Exceptional 19.6% |
| Jamaicans | 100.0 /100 | #16 | Exceptional 19.6% |
| Haitians | 100.0 /100 | #17 | Exceptional 19.7% |
| Hopi | 100.0 /100 | #18 | Exceptional 20.0% |
| Immigrants | Dominica | 100.0 /100 | #19 | Exceptional 20.0% |
| Bahamians | 100.0 /100 | #20 | Exceptional 20.2% |
| Immigrants | Caribbean | 100.0 /100 | #21 | Exceptional 20.4% |
| Immigrants | Liberia | 100.0 /100 | #22 | Exceptional 20.6% |
| Immigrants | Dominican Republic | 100.0 /100 | #23 | Exceptional 20.6% |
| Dominicans | 100.0 /100 | #24 | Exceptional 20.6% |
| Senegalese | 100.0 /100 | #25 | Exceptional 20.7% |
| Pueblo | 100.0 /100 | #26 | Exceptional 20.7% |
| Immigrants | Armenia | 100.0 /100 | #27 | Exceptional 20.7% |
| Inupiat | 100.0 /100 | #28 | Exceptional 20.8% |
| Immigrants | Senegal | 100.0 /100 | #29 | Exceptional 20.9% |
| Immigrants | Bangladesh | 100.0 /100 | #30 | Exceptional 20.9% |
| Vietnamese | 100.0 /100 | #31 | Exceptional 21.0% |
| Immigrants | Yemen | 100.0 /100 | #32 | Exceptional 21.1% |
| Immigrants | Bahamas | 100.0 /100 | #33 | Exceptional 21.1% |