Indian (Asian) vs Immigrants from Costa Rica Median Earnings
COMPARE
Indian (Asian)
Immigrants from Costa Rica
Median Earnings
Median Earnings Comparison
Indians (Asian)
Immigrants from Costa Rica
$56,253
MEDIAN EARNINGS
100.0/ 100
METRIC RATING
15th/ 347
METRIC RANK
$45,928
MEDIAN EARNINGS
33.0/ 100
METRIC RATING
194th/ 347
METRIC RANK
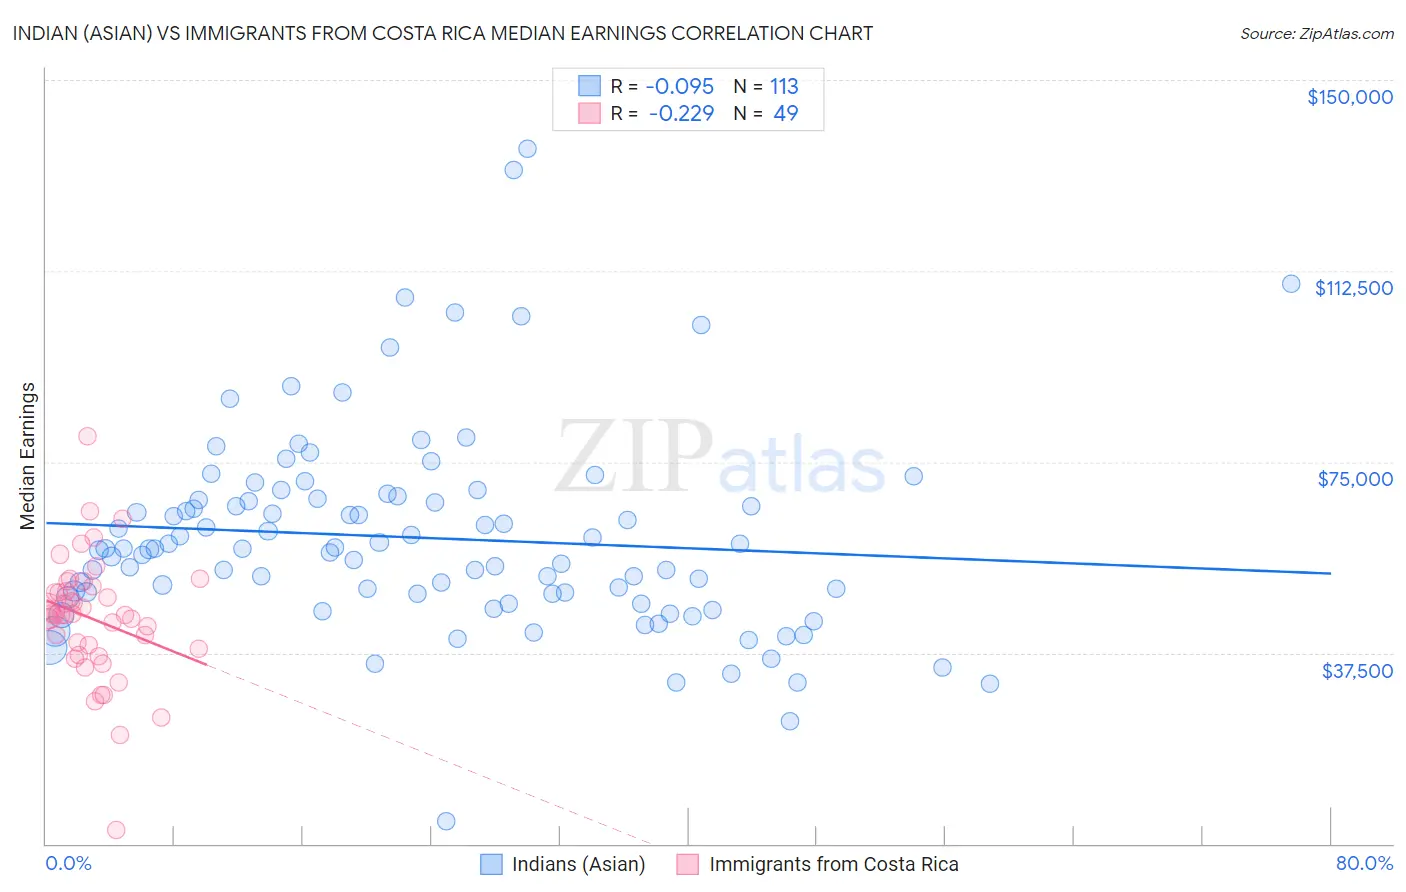
Indian (Asian) vs Immigrants from Costa Rica Median Earnings Correlation Chart
The statistical analysis conducted on geographies consisting of 495,313,309 people shows a slight negative correlation between the proportion of Indians (Asian) and median earnings in the United States with a correlation coefficient (R) of -0.095 and weighted average of $56,253. Similarly, the statistical analysis conducted on geographies consisting of 204,262,782 people shows a weak negative correlation between the proportion of Immigrants from Costa Rica and median earnings in the United States with a correlation coefficient (R) of -0.229 and weighted average of $45,928, a difference of 22.5%.
Median Earnings Correlation Summary
| Measurement | Indian (Asian) | Immigrants from Costa Rica |
| Minimum | $4,382 | $2,615 |
| Maximum | $136,388 | $80,083 |
| Range | $132,006 | $77,468 |
| Mean | $60,085 | $44,180 |
| Median | $57,869 | $45,027 |
| Interquartile 25% (IQ1) | $48,728 | $37,709 |
| Interquartile 75% (IQ3) | $67,622 | $50,100 |
| Interquartile Range (IQR) | $18,894 | $12,390 |
| Standard Deviation (Sample) | $20,110 | $12,240 |
| Standard Deviation (Population) | $20,020 | $12,114 |
Similar Demographics by Median Earnings
Demographics Similar to Indians (Asian) by Median Earnings
In terms of median earnings, the demographic groups most similar to Indians (Asian) are Immigrants from Australia ($56,305, a difference of 0.090%), Immigrants from Eastern Asia ($56,183, a difference of 0.12%), Immigrants from China ($56,638, a difference of 0.68%), Immigrants from Ireland ($56,854, a difference of 1.1%), and Immigrants from Israel ($57,034, a difference of 1.4%).
| Demographics | Rating | Rank | Median Earnings |
| Immigrants | Iran | 100.0 /100 | #8 | Exceptional $57,612 |
| Okinawans | 100.0 /100 | #9 | Exceptional $57,550 |
| Immigrants | South Central Asia | 100.0 /100 | #10 | Exceptional $57,114 |
| Immigrants | Israel | 100.0 /100 | #11 | Exceptional $57,034 |
| Immigrants | Ireland | 100.0 /100 | #12 | Exceptional $56,854 |
| Immigrants | China | 100.0 /100 | #13 | Exceptional $56,638 |
| Immigrants | Australia | 100.0 /100 | #14 | Exceptional $56,305 |
| Indians (Asian) | 100.0 /100 | #15 | Exceptional $56,253 |
| Immigrants | Eastern Asia | 100.0 /100 | #16 | Exceptional $56,183 |
| Eastern Europeans | 100.0 /100 | #17 | Exceptional $55,084 |
| Immigrants | Japan | 100.0 /100 | #18 | Exceptional $54,938 |
| Immigrants | Belgium | 100.0 /100 | #19 | Exceptional $54,679 |
| Cypriots | 100.0 /100 | #20 | Exceptional $54,589 |
| Burmese | 100.0 /100 | #21 | Exceptional $54,559 |
| Immigrants | Korea | 100.0 /100 | #22 | Exceptional $54,530 |
Demographics Similar to Immigrants from Costa Rica by Median Earnings
In terms of median earnings, the demographic groups most similar to Immigrants from Costa Rica are Guamanian/Chamorro ($45,933, a difference of 0.010%), German ($45,935, a difference of 0.020%), Finnish ($45,940, a difference of 0.030%), Immigrants from St. Vincent and the Grenadines ($45,908, a difference of 0.040%), and Yugoslavian ($45,846, a difference of 0.18%).
| Demographics | Rating | Rank | Median Earnings |
| Iraqis | 39.9 /100 | #187 | Fair $46,140 |
| Immigrants | Armenia | 38.3 /100 | #188 | Fair $46,094 |
| Spaniards | 37.2 /100 | #189 | Fair $46,059 |
| French Canadians | 36.1 /100 | #190 | Fair $46,026 |
| Finns | 33.4 /100 | #191 | Fair $45,940 |
| Germans | 33.2 /100 | #192 | Fair $45,935 |
| Guamanians/Chamorros | 33.2 /100 | #193 | Fair $45,933 |
| Immigrants | Costa Rica | 33.0 /100 | #194 | Fair $45,928 |
| Immigrants | St. Vincent and the Grenadines | 32.4 /100 | #195 | Fair $45,908 |
| Yugoslavians | 30.5 /100 | #196 | Fair $45,846 |
| Barbadians | 30.5 /100 | #197 | Fair $45,846 |
| Trinidadians and Tobagonians | 29.7 /100 | #198 | Fair $45,820 |
| Immigrants | Barbados | 29.6 /100 | #199 | Fair $45,816 |
| Immigrants | Azores | 29.5 /100 | #200 | Fair $45,812 |
| Celtics | 27.2 /100 | #201 | Fair $45,732 |