Indian (Asian) vs Colville Median Earnings
COMPARE
Indian (Asian)
Colville
Median Earnings
Median Earnings Comparison
Indians (Asian)
Colville
$56,253
MEDIAN EARNINGS
100.0/ 100
METRIC RATING
15th/ 347
METRIC RANK
$42,151
MEDIAN EARNINGS
0.2/ 100
METRIC RATING
279th/ 347
METRIC RANK
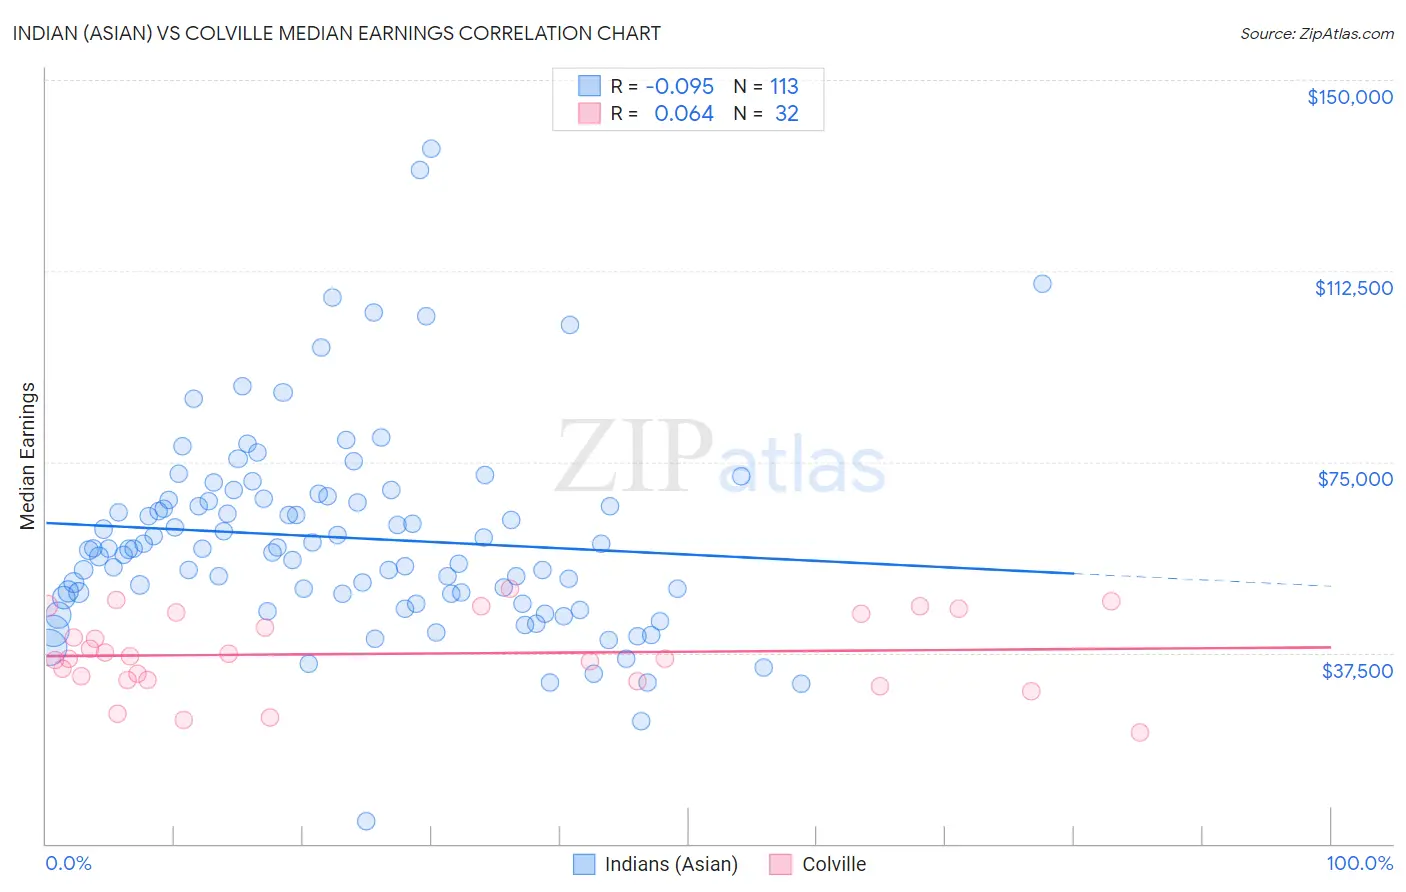
Indian (Asian) vs Colville Median Earnings Correlation Chart
The statistical analysis conducted on geographies consisting of 495,313,309 people shows a slight negative correlation between the proportion of Indians (Asian) and median earnings in the United States with a correlation coefficient (R) of -0.095 and weighted average of $56,253. Similarly, the statistical analysis conducted on geographies consisting of 34,684,676 people shows a slight positive correlation between the proportion of Colville and median earnings in the United States with a correlation coefficient (R) of 0.064 and weighted average of $42,151, a difference of 33.5%.
Median Earnings Correlation Summary
| Measurement | Indian (Asian) | Colville |
| Minimum | $4,382 | $21,944 |
| Maximum | $136,388 | $50,045 |
| Range | $132,006 | $28,101 |
| Mean | $60,085 | $37,312 |
| Median | $57,869 | $36,531 |
| Interquartile 25% (IQ1) | $48,728 | $32,193 |
| Interquartile 75% (IQ3) | $67,622 | $45,323 |
| Interquartile Range (IQR) | $18,894 | $13,130 |
| Standard Deviation (Sample) | $20,110 | $7,666 |
| Standard Deviation (Population) | $20,020 | $7,545 |
Similar Demographics by Median Earnings
Demographics Similar to Indians (Asian) by Median Earnings
In terms of median earnings, the demographic groups most similar to Indians (Asian) are Immigrants from Australia ($56,305, a difference of 0.090%), Immigrants from Eastern Asia ($56,183, a difference of 0.12%), Immigrants from China ($56,638, a difference of 0.68%), Immigrants from Ireland ($56,854, a difference of 1.1%), and Immigrants from Israel ($57,034, a difference of 1.4%).
| Demographics | Rating | Rank | Median Earnings |
| Immigrants | Iran | 100.0 /100 | #8 | Exceptional $57,612 |
| Okinawans | 100.0 /100 | #9 | Exceptional $57,550 |
| Immigrants | South Central Asia | 100.0 /100 | #10 | Exceptional $57,114 |
| Immigrants | Israel | 100.0 /100 | #11 | Exceptional $57,034 |
| Immigrants | Ireland | 100.0 /100 | #12 | Exceptional $56,854 |
| Immigrants | China | 100.0 /100 | #13 | Exceptional $56,638 |
| Immigrants | Australia | 100.0 /100 | #14 | Exceptional $56,305 |
| Indians (Asian) | 100.0 /100 | #15 | Exceptional $56,253 |
| Immigrants | Eastern Asia | 100.0 /100 | #16 | Exceptional $56,183 |
| Eastern Europeans | 100.0 /100 | #17 | Exceptional $55,084 |
| Immigrants | Japan | 100.0 /100 | #18 | Exceptional $54,938 |
| Immigrants | Belgium | 100.0 /100 | #19 | Exceptional $54,679 |
| Cypriots | 100.0 /100 | #20 | Exceptional $54,589 |
| Burmese | 100.0 /100 | #21 | Exceptional $54,559 |
| Immigrants | Korea | 100.0 /100 | #22 | Exceptional $54,530 |
Demographics Similar to Colville by Median Earnings
In terms of median earnings, the demographic groups most similar to Colville are Cajun ($42,189, a difference of 0.090%), Hmong ($42,111, a difference of 0.10%), Central American ($42,280, a difference of 0.31%), Spanish American ($42,316, a difference of 0.39%), and Marshallese ($41,969, a difference of 0.43%).
| Demographics | Rating | Rank | Median Earnings |
| Iroquois | 0.4 /100 | #272 | Tragic $42,430 |
| Immigrants | Dominica | 0.4 /100 | #273 | Tragic $42,420 |
| Immigrants | El Salvador | 0.4 /100 | #274 | Tragic $42,413 |
| Immigrants | Belize | 0.3 /100 | #275 | Tragic $42,339 |
| Spanish Americans | 0.3 /100 | #276 | Tragic $42,316 |
| Central Americans | 0.3 /100 | #277 | Tragic $42,280 |
| Cajuns | 0.3 /100 | #278 | Tragic $42,189 |
| Colville | 0.2 /100 | #279 | Tragic $42,151 |
| Hmong | 0.2 /100 | #280 | Tragic $42,111 |
| Marshallese | 0.2 /100 | #281 | Tragic $41,969 |
| Africans | 0.2 /100 | #282 | Tragic $41,955 |
| Dominicans | 0.2 /100 | #283 | Tragic $41,864 |
| Blackfeet | 0.2 /100 | #284 | Tragic $41,822 |
| Immigrants | Nicaragua | 0.1 /100 | #285 | Tragic $41,737 |
| Mexican American Indians | 0.1 /100 | #286 | Tragic $41,719 |