Indian (Asian) vs Hawaiian Wage/Income Gap
COMPARE
Indian (Asian)
Hawaiian
Wage/Income Gap
Wage/Income Gap Comparison
Indians (Asian)
Hawaiians
26.4%
WAGE/INCOME GAP
16.5/ 100
METRIC RATING
206th/ 347
METRIC RANK
24.9%
WAGE/INCOME GAP
89.3/ 100
METRIC RATING
141st/ 347
METRIC RANK
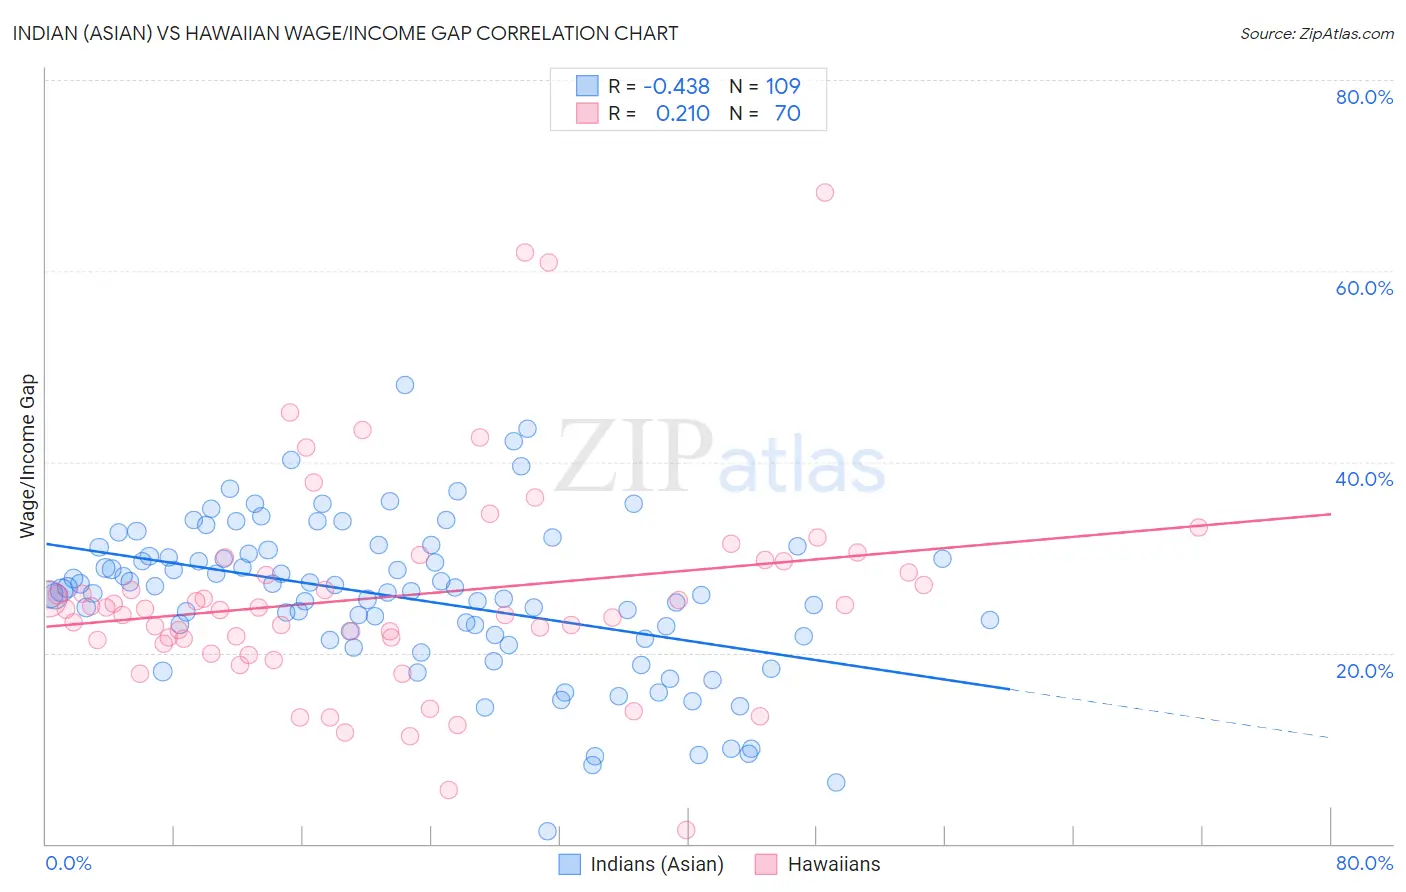
Indian (Asian) vs Hawaiian Wage/Income Gap Correlation Chart
The statistical analysis conducted on geographies consisting of 494,711,771 people shows a moderate negative correlation between the proportion of Indians (Asian) and wage/income gap percentage in the United States with a correlation coefficient (R) of -0.438 and weighted average of 26.4%. Similarly, the statistical analysis conducted on geographies consisting of 327,384,516 people shows a weak positive correlation between the proportion of Hawaiians and wage/income gap percentage in the United States with a correlation coefficient (R) of 0.210 and weighted average of 24.9%, a difference of 6.3%.
Wage/Income Gap Correlation Summary
| Measurement | Indian (Asian) | Hawaiian |
| Minimum | 1.2% | 1.4% |
| Maximum | 48.1% | 68.2% |
| Range | 46.8% | 66.8% |
| Mean | 25.8% | 25.9% |
| Median | 26.4% | 24.6% |
| Interquartile 25% (IQ1) | 21.6% | 21.4% |
| Interquartile 75% (IQ3) | 30.6% | 29.6% |
| Interquartile Range (IQR) | 9.0% | 8.2% |
| Standard Deviation (Sample) | 8.2% | 11.4% |
| Standard Deviation (Population) | 8.1% | 11.3% |
Similar Demographics by Wage/Income Gap
Demographics Similar to Indians (Asian) by Wage/Income Gap
In terms of wage/income gap, the demographic groups most similar to Indians (Asian) are Immigrants from Italy (26.5%, a difference of 0.080%), Immigrants from Southern Europe (26.4%, a difference of 0.090%), Immigrants from Russia (26.4%, a difference of 0.27%), Laotian (26.4%, a difference of 0.29%), and Immigrants from Eastern Europe (26.4%, a difference of 0.29%).
| Demographics | Rating | Rank | Wage/Income Gap |
| Dutch West Indians | 21.0 /100 | #199 | Fair 26.3% |
| Delaware | 20.9 /100 | #200 | Fair 26.3% |
| Immigrants | Syria | 19.3 /100 | #201 | Poor 26.4% |
| Laotians | 19.2 /100 | #202 | Poor 26.4% |
| Immigrants | Eastern Europe | 19.2 /100 | #203 | Poor 26.4% |
| Immigrants | Russia | 19.0 /100 | #204 | Poor 26.4% |
| Immigrants | Southern Europe | 17.3 /100 | #205 | Poor 26.4% |
| Indians (Asian) | 16.5 /100 | #206 | Poor 26.4% |
| Immigrants | Italy | 15.8 /100 | #207 | Poor 26.5% |
| Egyptians | 12.7 /100 | #208 | Poor 26.6% |
| Immigrants | Kuwait | 12.6 /100 | #209 | Poor 26.6% |
| Arabs | 12.3 /100 | #210 | Poor 26.6% |
| Mongolians | 11.4 /100 | #211 | Poor 26.6% |
| Iraqis | 11.2 /100 | #212 | Poor 26.6% |
| Immigrants | Iraq | 10.3 /100 | #213 | Poor 26.7% |
Demographics Similar to Hawaiians by Wage/Income Gap
In terms of wage/income gap, the demographic groups most similar to Hawaiians are Immigrants from Nepal (24.9%, a difference of 0.010%), Hispanic or Latino (24.9%, a difference of 0.040%), Immigrants from Bosnia and Herzegovina (24.8%, a difference of 0.15%), Afghan (24.9%, a difference of 0.20%), and Immigrants from Uganda (24.9%, a difference of 0.22%).
| Demographics | Rating | Rank | Wage/Income Gap |
| Mexican American Indians | 92.2 /100 | #134 | Exceptional 24.7% |
| South American Indians | 92.0 /100 | #135 | Exceptional 24.7% |
| Armenians | 91.3 /100 | #136 | Exceptional 24.8% |
| Immigrants | South Eastern Asia | 90.9 /100 | #137 | Exceptional 24.8% |
| Immigrants | Bosnia and Herzegovina | 90.1 /100 | #138 | Exceptional 24.8% |
| Hispanics or Latinos | 89.5 /100 | #139 | Excellent 24.9% |
| Immigrants | Nepal | 89.3 /100 | #140 | Excellent 24.9% |
| Hawaiians | 89.3 /100 | #141 | Excellent 24.9% |
| Afghans | 88.1 /100 | #142 | Excellent 24.9% |
| Immigrants | Uganda | 88.0 /100 | #143 | Excellent 24.9% |
| Chippewa | 86.9 /100 | #144 | Excellent 25.0% |
| Comanche | 85.2 /100 | #145 | Excellent 25.0% |
| South Americans | 85.2 /100 | #146 | Excellent 25.0% |
| Malaysians | 84.9 /100 | #147 | Excellent 25.0% |
| Iroquois | 83.9 /100 | #148 | Excellent 25.1% |