Immigrants from Western Europe vs Spanish American Indian Median Male Earnings
COMPARE
Immigrants from Western Europe
Spanish American Indian
Median Male Earnings
Median Male Earnings Comparison
Immigrants from Western Europe
Spanish American Indians
$60,334
MEDIAN MALE EARNINGS
99.7/ 100
METRIC RATING
72nd/ 347
METRIC RANK
$44,010
MEDIAN MALE EARNINGS
0.0/ 100
METRIC RATING
335th/ 347
METRIC RANK
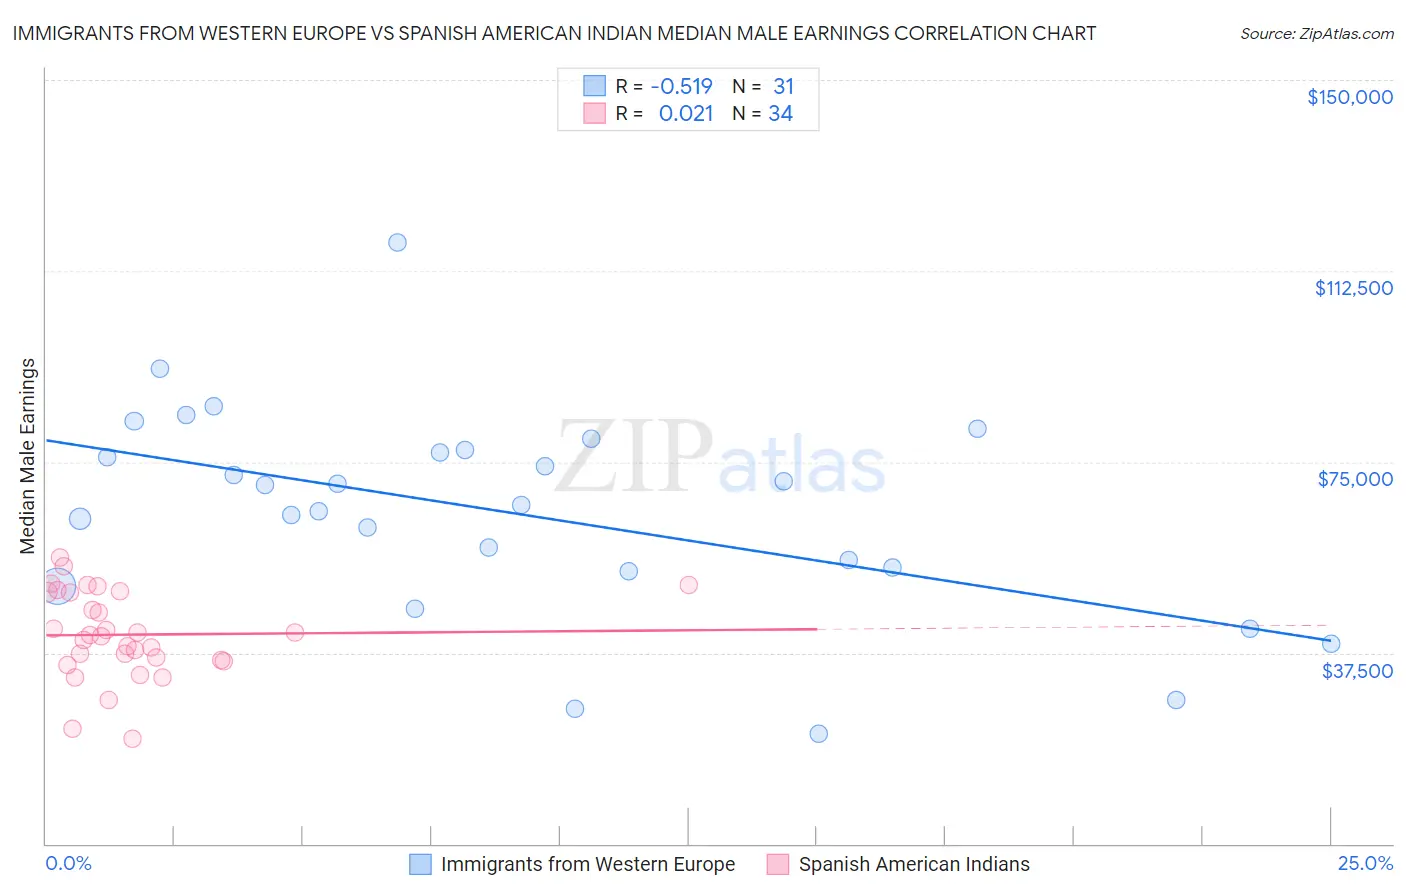
Immigrants from Western Europe vs Spanish American Indian Median Male Earnings Correlation Chart
The statistical analysis conducted on geographies consisting of 493,675,126 people shows a substantial negative correlation between the proportion of Immigrants from Western Europe and median male earnings in the United States with a correlation coefficient (R) of -0.519 and weighted average of $60,334. Similarly, the statistical analysis conducted on geographies consisting of 73,148,083 people shows no correlation between the proportion of Spanish American Indians and median male earnings in the United States with a correlation coefficient (R) of 0.021 and weighted average of $44,010, a difference of 37.1%.
Median Male Earnings Correlation Summary
| Measurement | Immigrants from Western Europe | Spanish American Indian |
| Minimum | $21,715 | $20,599 |
| Maximum | $118,110 | $56,169 |
| Range | $96,395 | $35,570 |
| Mean | $64,948 | $41,061 |
| Median | $66,494 | $40,899 |
| Interquartile 25% (IQ1) | $53,531 | $35,978 |
| Interquartile 75% (IQ3) | $77,220 | $49,409 |
| Interquartile Range (IQR) | $23,689 | $13,431 |
| Standard Deviation (Sample) | $20,607 | $8,549 |
| Standard Deviation (Population) | $20,272 | $8,423 |
Similar Demographics by Median Male Earnings
Demographics Similar to Immigrants from Western Europe by Median Male Earnings
In terms of median male earnings, the demographic groups most similar to Immigrants from Western Europe are Mongolian ($60,350, a difference of 0.030%), Immigrants from Bulgaria ($60,358, a difference of 0.040%), Immigrants from Canada ($60,388, a difference of 0.090%), Immigrants from North America ($60,265, a difference of 0.12%), and Argentinean ($60,117, a difference of 0.36%).
| Demographics | Rating | Rank | Median Male Earnings |
| Immigrants | Indonesia | 99.8 /100 | #65 | Exceptional $60,935 |
| Immigrants | Croatia | 99.8 /100 | #66 | Exceptional $60,914 |
| Immigrants | Spain | 99.8 /100 | #67 | Exceptional $60,750 |
| Immigrants | Serbia | 99.7 /100 | #68 | Exceptional $60,600 |
| Immigrants | Canada | 99.7 /100 | #69 | Exceptional $60,388 |
| Immigrants | Bulgaria | 99.7 /100 | #70 | Exceptional $60,358 |
| Mongolians | 99.7 /100 | #71 | Exceptional $60,350 |
| Immigrants | Western Europe | 99.7 /100 | #72 | Exceptional $60,334 |
| Immigrants | North America | 99.7 /100 | #73 | Exceptional $60,265 |
| Argentineans | 99.6 /100 | #74 | Exceptional $60,117 |
| Immigrants | Bolivia | 99.6 /100 | #75 | Exceptional $60,088 |
| Romanians | 99.6 /100 | #76 | Exceptional $60,063 |
| Paraguayans | 99.5 /100 | #77 | Exceptional $59,975 |
| Immigrants | Egypt | 99.5 /100 | #78 | Exceptional $59,925 |
| Immigrants | Ukraine | 99.5 /100 | #79 | Exceptional $59,820 |
Demographics Similar to Spanish American Indians by Median Male Earnings
In terms of median male earnings, the demographic groups most similar to Spanish American Indians are Immigrants from Yemen ($44,083, a difference of 0.17%), Immigrants from Congo ($44,204, a difference of 0.44%), Immigrants from Cuba ($43,461, a difference of 1.3%), Bahamian ($44,756, a difference of 1.7%), and Native/Alaskan ($44,775, a difference of 1.7%).
| Demographics | Rating | Rank | Median Male Earnings |
| Kiowa | 0.0 /100 | #328 | Tragic $45,094 |
| Yakama | 0.0 /100 | #329 | Tragic $45,002 |
| Immigrants | Mexico | 0.0 /100 | #330 | Tragic $44,960 |
| Natives/Alaskans | 0.0 /100 | #331 | Tragic $44,775 |
| Bahamians | 0.0 /100 | #332 | Tragic $44,756 |
| Immigrants | Congo | 0.0 /100 | #333 | Tragic $44,204 |
| Immigrants | Yemen | 0.0 /100 | #334 | Tragic $44,083 |
| Spanish American Indians | 0.0 /100 | #335 | Tragic $44,010 |
| Immigrants | Cuba | 0.0 /100 | #336 | Tragic $43,461 |
| Menominee | 0.0 /100 | #337 | Tragic $42,581 |
| Crow | 0.0 /100 | #338 | Tragic $42,434 |
| Pima | 0.0 /100 | #339 | Tragic $42,357 |
| Navajo | 0.0 /100 | #340 | Tragic $42,098 |
| Hopi | 0.0 /100 | #341 | Tragic $42,060 |
| Arapaho | 0.0 /100 | #342 | Tragic $41,758 |